Seattle Home Prices: $839K, Down 2% — 23 ZIPs Analyzed (2026)
$839,413. That’s what a typical home costs in Seattle right now — and it’s actually less than it was a year ago.
The city’s median home value slipped 2.0% year over year as of February 2026. For a market that spent most of the last decade climbing, that’s a notable shift. Across 23 ZIP codes, prices range from $426K to nearly $1.35 million.
Quick answer: The average home price in Seattle, WA is $839,413 as of February 2026, down 2.0% year over year according to Zillow.
Current Home Prices in Seattle
Here’s where Seattle stands right now:
| Metric | Value |
|---|---|
| Median Home Value | $839,413 |
| Year-over-Year Change | -2.0% |
| Lowest ZIP Code Value | $426,490 |
| Highest ZIP Code Value | $1,349,810 |
| Number of ZIPs Tracked | 23 |
| Data as of | February 2026 |
A 2% decline doesn’t sound like much. But on an $839K home, that’s roughly $17,000 in lost value over 12 months.
The price spread across the city is enormous. The gap between the cheapest and most expensive ZIP codes is over $923,000. That means where you buy in Seattle matters more than when you buy.
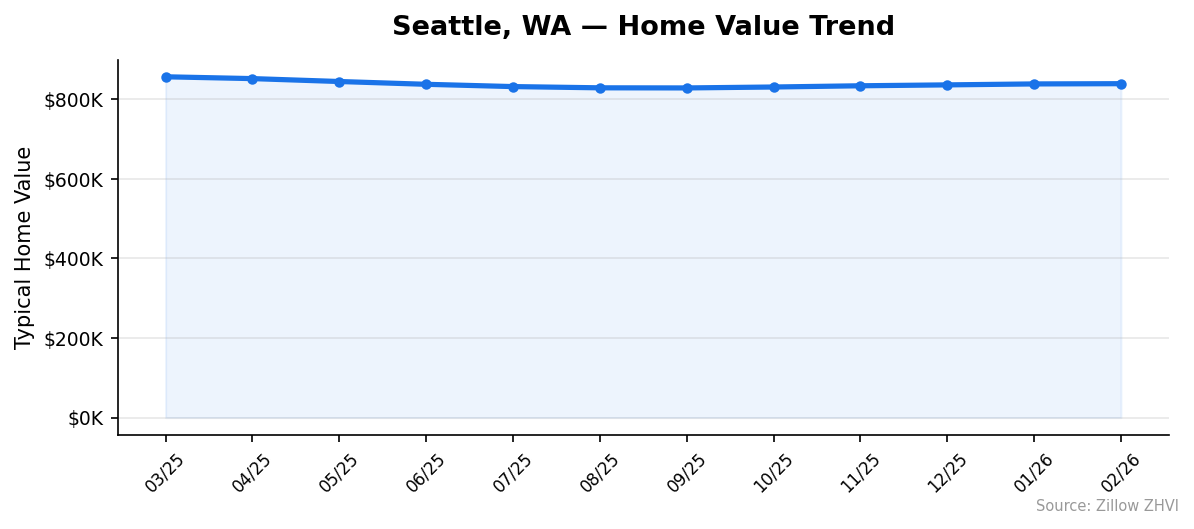
Seattle’s correction started in spring 2025. The median hit $857K in March of that year, then dropped steadily through August before bouncing back slightly into early 2026. The current $839K figure sits below every month from March through June 2025.
For buyers who’ve been priced out, this is the first sustained dip in years. For sellers, the days of automatic appreciation are on pause.
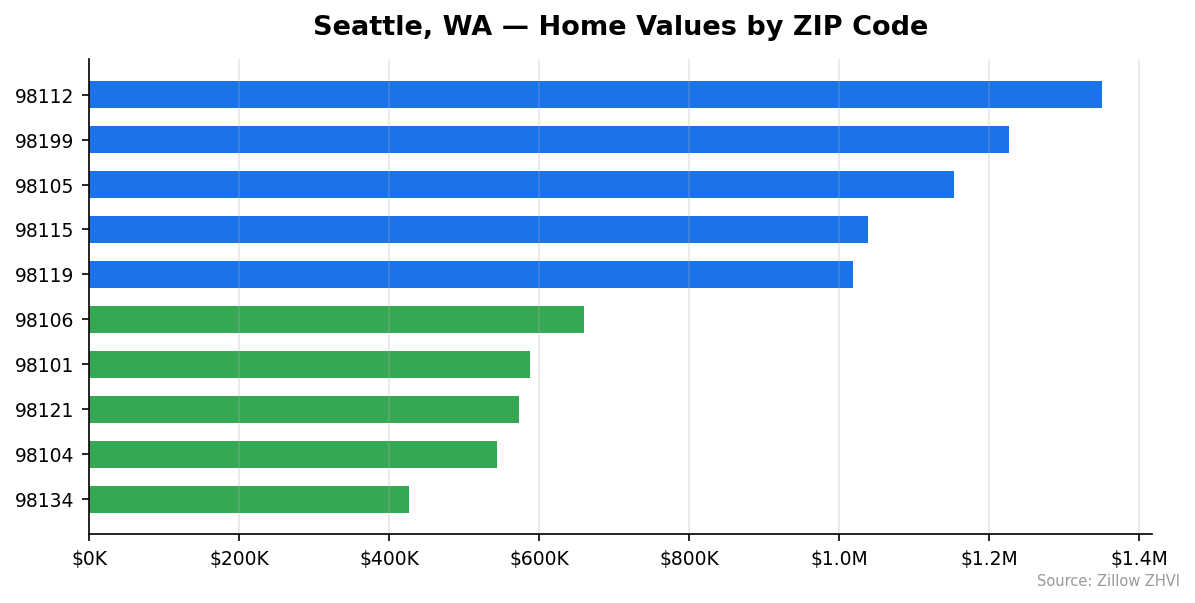
Seattle Home Prices by Neighborhood
All 23 tracked ZIP codes, ranked from most to least expensive:
| ZIP Code | Typical Home Value | Typical Monthly Rent |
|---|---|---|
| 98112 | $1,349,810 | $2,180 |
| 98199 | $1,225,654 | $2,441 |
| 98105 | $1,152,263 | $2,000 |
| 98115 | $1,037,750 | $2,125 |
| 98119 | $1,018,682 | $1,985 |
| 98116 | $988,390 | $2,217 |
| 98117 | $976,808 | $2,221 |
| 98136 | $927,663 | $2,280 |
| 98103 | $909,480 | $2,140 |
| 98107 | $854,037 | $2,088 |
| 98122 | $821,036 | $1,933 |
| 98125 | $813,762 | $1,808 |
| 98144 | $780,796 | $1,986 |
| 98126 | $756,135 | $2,126 |
| 98109 | $749,615 | $2,497 |
| 98118 | $734,884 | $1,860 |
| 98102 | $729,999 | $1,946 |
| 98108 | $689,498 | $2,272 |
| 98106 | $659,683 | $2,375 |
| 98101 | $587,798 | $2,607 |
| 98121 | $572,467 | $2,754 |
| 98104 | $543,788 | $2,077 |
| 98134 | $426,490 | N/A |
Most Expensive ZIPs
98112 — $1,349,810. Seattle’s priciest ZIP at 61% above the city median. Rents here run $2,180/month — relatively modest for the home values, which signals an area dominated by owner-occupiers and long-term holders.
98199 — $1,225,654. The second most expensive ZIP commands $2,441/month in rent. Home values here sit 46% above the city average.
98105 — $1,152,263. The University District–adjacent ZIP rounds out the top three at 37% above median, with some of the lowest rents in the dataset at $2,000/month.
Most Affordable ZIPs
98134 — $426,490. Georgetown and SoDo offer the only sub-$500K entry in Seattle. That’s roughly half the city median. Rent data is not available for this ZIP.
98104 — $543,788. Downtown’s condo-heavy ZIP comes in at 35% below the city median with rents of $2,077/month.
98121 — $572,467. Belltown sits 32% below median for home values but has the highest rent in the city at $2,754/month — a sign of the dense rental market in this area.
Rent vs Buy in Seattle
Renting is dramatically cheaper than buying in Seattle on a monthly basis.
The typical rent across Seattle’s ZIP codes falls in the $2,000–$2,200 range. A mortgage on the median-priced home tells a different story. With 20% down on $839,413, you’d finance about $671,530. At a 7% rate over 30 years, that’s roughly $4,470/month in principal and interest — before property taxes, insurance, or maintenance.
| Cost Comparison | Monthly |
|---|---|
| Typical Rent | ~$2,100 |
| Mortgage (P&I, 20% down, 7%) | ~$4,470 |
| Estimated Difference | ~$2,370 |
That $2,370 monthly gap is significant. A renter could invest that difference and potentially come out ahead, especially during a period of falling home values.
Some ZIPs flip this math. In 98134, where homes run $426K, the monthly mortgage drops to about $2,270 — comparable to rents in nearby ZIPs. Downtown areas like 98121 show the opposite pattern: low home values ($572K) but the city’s highest rents ($2,754), making buying more competitive.
The rent-to-price ratio varies wildly across the city. In 98112, a $1.35M home rents for $2,180/month. In 98106, a $660K home rents for $2,375. If you’re looking at investment returns, the lower-priced ZIPs with higher rents offer better yield.
Population Growth and Migration
Seattle added over 40,000 people in four years.
The city’s population reached 780,995 in 2024, up 5.5% from 740,600 in 2020. That growth wasn’t linear — the city actually lost about 7,000 residents in 2021 before bouncing back sharply.
| Year | Population | Change |
|---|---|---|
| 2020 | 740,600 | — |
| 2021 | 733,700 | -6,900 |
| 2022 | 751,454 | +17,754 |
| 2023 | 764,182 | +12,728 |
| 2024 | 780,995 | +16,813 |
The 2021 dip aligns with remote-work migration during the pandemic. But by 2022, that trend reversed. Seattle has added roughly 15,000–17,000 residents per year since.
How does Seattle compare to other Washington cities?
| City | Population (2024) | 4-Year Growth |
|---|---|---|
| Seattle | 780,995 | 5.5% |
| Spokane Valley | 108,267 | 4.5% |
| Vancouver | 198,992 | 4.0% |
| Tacoma | 228,202 | 3.8% |
| Everett | 113,011 | 1.9% |
| Bellevue | 154,377 | 1.7% |
Seattle is growing faster than every comparison city in the state. That sustained population growth puts upward pressure on housing demand — which makes the 2% price decline worth watching. Prices are dipping despite a city that keeps adding residents.
Seattle Housing Market Trends
Here’s how the median home value moved over the last 12 months:
| Month | Median Value | Min ZIP | Max ZIP |
|---|---|---|---|
| Mar 2025 | $856,752 | $448,484 | $1,365,273 |
| Apr 2025 | $852,183 | $446,144 | $1,360,259 |
| May 2025 | $844,881 | $442,400 | $1,351,095 |
| Jun 2025 | $837,876 | $438,613 | $1,341,015 |
| Jul 2025 | $832,126 | $434,859 | $1,332,739 |
| Aug 2025 | $829,022 | $431,745 | $1,328,130 |
| Sep 2025 | $828,742 | $429,605 | $1,328,491 |
| Oct 2025 | $831,064 | $428,632 | $1,333,309 |
| Nov 2025 | $834,149 | $427,996 | $1,339,097 |
| Dec 2025 | $836,400 | $427,087 | $1,342,853 |
| Jan 2026 | $838,801 | $427,149 | $1,347,175 |
| Feb 2026 | $839,413 | $426,490 | $1,349,810 |
The pattern tells a clear story. Seattle hit a local peak of $857K in March 2025, then fell for six consecutive months to a low of $829K in September 2025. Since then, prices have climbed back for five straight months.
The recovery is slow. From September to February, the median gained about $10,700 — roughly $2,100 per month. At that pace, it would take another eight months to return to the March 2025 peak.
One detail stands out: while the median has rebounded, the minimum ZIP value kept falling. The cheapest ZIP dropped from $448K in March to $427K in February. The most expensive ZIP followed a similar arc but has nearly recovered. Expensive neighborhoods are bouncing back faster than affordable ones.
Is Seattle a Good Place to Buy in 2026?
The data points toward a buyer-friendly market — at least by Seattle standards.
Prices are down 2% year over year. The recovery from September’s low is gradual, not explosive. You’re not competing against the kind of rapid appreciation that forces panic buying.
That said, $839K is still a lot of money. With a 20% down payment of $168K and monthly payments north of $4,400, Seattle remains accessible mainly to high-income households.
The strongest case for buying: population growth. Seattle is adding 15,000+ residents a year. That demand doesn’t disappear. If you can afford the payment and plan to hold for 5+ years, the fundamentals support the purchase.
The strongest case for waiting: the cheapest ZIP codes are still declining. If you’re targeting the sub-$600K range, prices may not have bottomed yet.
Seattle Housing Market Outlook for 2026-2027
The five-month uptrend from September 2025 through February 2026 suggests Seattle’s correction has likely ended at the city-wide level.
If the current pace continues — roughly $2,000/month in gains — the median would approach $850K by summer 2026. That’s still below the March 2025 peak of $857K.
The trend suggests a flat-to-slightly-rising market rather than a sharp rebound. Monthly gains have been consistent but modest, ranging from $600 to $5,300 over the last five months.
Watch the spring selling season. Seattle typically sees price increases from March through June. If the seasonal pattern holds, 2026 could see the median briefly touch $850K–$860K before cooling in late summer. But without the rapid appreciation of prior years, don’t expect prices to break new highs soon.
Similar Markets in WA
If you’re exploring beyond Seattle, here are other Washington markets worth comparing:
- Bothell — A suburban option just north of Seattle with access to the same job market.
- Everett — About 30 miles north, offering a lower entry point while staying within the metro.
- Vancouver — On the Oregon border with no state income tax, a popular choice for those priced out of Portland.
- Spokane — Eastern Washington’s largest city, typically a fraction of Seattle’s prices.
- Olympia — The state capital, smaller and more affordable than the Seattle metro.
Frequently Asked Questions
What is the average home price in Seattle?
The average home price in Seattle is $839,413 as of February 2026. That’s the city-wide median. Individual ZIP codes range from $426,490 in 98134 to $1,349,810 in 98112 — a spread of over $923,000.
Are home prices going up or down in Seattle?
Down 2.0% year over year. Prices peaked at $857K in March 2025, dropped to $829K by September, then started a slow recovery. As of February 2026, the median sits at $839K — still below where it was a year ago.
Is it cheaper to rent or buy in Seattle?
Renting is significantly cheaper. The typical rent runs about $2,100/month. A mortgage on the median home at 7% with 20% down costs roughly $4,470/month in principal and interest alone. That’s a $2,370/month gap before taxes and insurance.
What is the most affordable neighborhood in Seattle?
ZIP code 98134, covering the Georgetown and SoDo areas, is the cheapest at $426,490. It’s the only ZIP in Seattle under $500,000. The next most affordable are 98104 ($544K) and 98121 ($572K), both downtown-area ZIPs with heavy condo inventory.
Methodology
Home values are based on the Zillow Home Value Index (ZHVI), a smoothed measure of typical home values in the 35th to 65th percentile range. Rent estimates use the Zillow Observed Rent Index (ZORI). Population figures come from the U.S. Census Bureau Population Estimates Program (2020-2024 vintage). All datasets are publicly available. Housing data updated 2026-02-28.