Yuma Home Prices: $304K, Up 1.0% — 3 ZIPs Analyzed (2026)
$304,094. That’s what a typical home costs in Yuma right now. Prices crept up 1.0% over the past year — not a boom, not a bust. Just a slow grind higher in a desert city that remains one of Arizona’s more affordable markets.
Quick answer: The average home price in Yuma, AZ is $304,094 as of February 2026, up 1.0% year over year according to Zillow.
Current Home Prices in Yuma
The Yuma housing market sits well below Arizona’s pricier metro areas. Here’s where things stand:
| Metric | Value |
|---|---|
| Median Home Value | $304,094 |
| Year-over-Year Change | +1.0% |
| Lowest Price (ZIP 85364) | $262,766 |
| Highest Price (ZIP 85365) | $328,382 |
| Number of ZIP Codes Tracked | 3 |
| Data as of | February 2026 |
A 1% annual gain means Yuma homes appreciated roughly $3,000 over the past twelve months. That’s modest by any standard. For context, the gap between the cheapest and most expensive ZIP codes is about $65,600 — so where you buy within city limits matters more than when.
The price range tells you something else: Yuma isn’t a market with wild swings between neighborhoods. A $65K spread across three ZIPs is tight. You won’t find one part of town at $150K and another at $500K. The entire market moves together.
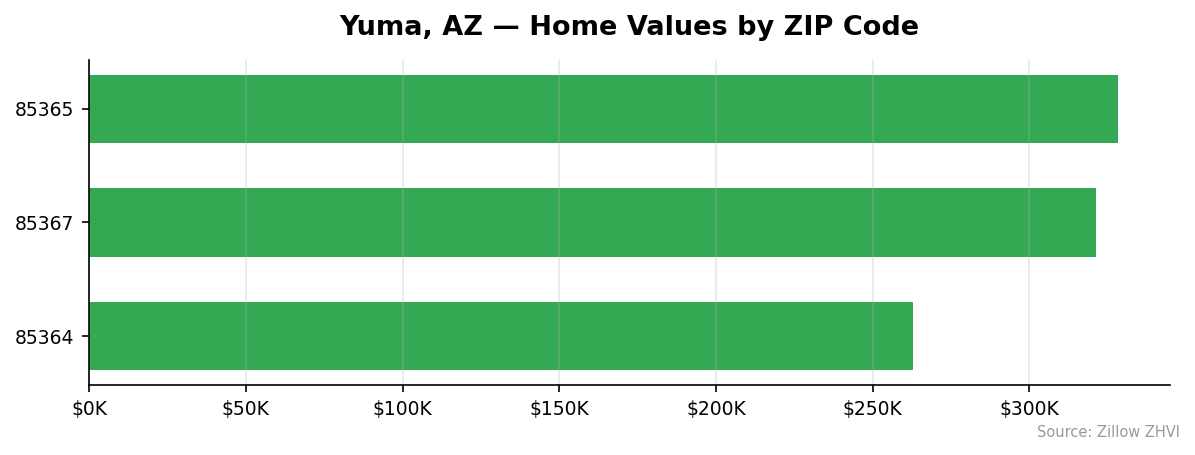
Yuma Home Prices by Neighborhood
All three tracked ZIP codes in Yuma show distinct price levels:
| ZIP Code | Median Home Value | Monthly Rent |
|---|---|---|
| 85364 | $262,766 | $1,214 |
| 85365 | $328,382 | $1,637 |
| 85367 | $321,134 | $1,632 |
Most Expensive
85365 tops the list at $328,382 — about 8% above the city median. Rents here are the highest in Yuma at $1,637 per month, which tracks with the elevated home values.
85367 comes in close behind at $321,134. Rent runs $1,632, nearly identical to 85365. The $7,200 price gap between these two ZIPs is small enough that buyers are essentially choosing between two similar markets.
Most Affordable
85364 is the clear budget pick at $262,766 — about $41,000 below the city median. Rent is also the lowest at $1,214 per month, making it the most accessible entry point for both renters and buyers in Yuma.
Rent vs Buy in Yuma
Here’s what the numbers look like side by side:
| ZIP Code | Monthly Rent | Est. Mortgage Payment* | Difference |
|---|---|---|---|
| 85364 | $1,214 | $1,399 | +$185 |
| 85365 | $1,637 | $1,749 | +$112 |
| 85367 | $1,632 | $1,710 | +$78 |
*Estimated mortgage: 20% down, 30-year fixed at 7.0%, principal and interest only. Does not include taxes, insurance, or HOA fees.
Renting is cheaper across the board, but the gap is narrow. In 85367, you’d pay just $78 more per month to own instead of rent. That’s close to break-even when you factor in equity building.
The city-wide average rent sits around $1,494. A mortgage on the median home runs about $1,618. The $124 monthly difference isn’t dramatic, but add property taxes, insurance, and maintenance and the true cost of ownership widens.
For buyers with a long time horizon, the math shifts. Even at 1% annual appreciation, a $304K home gains roughly $3,000 per year in value. That offsets some of the ownership premium.
Population Growth and Migration
Yuma is growing — not explosively, but consistently.
| Year | Population |
|---|---|
| 2020 | 97,342 |
| 2021 | 98,453 |
| 2022 | 99,720 |
| 2023 | 101,635 |
| 2024 | 103,559 |
The city added 6,217 residents between 2020 and 2024, a 6.4% increase. Growth accelerated in 2023 with nearly 2,000 new residents in a single year.
How does that compare to other Arizona cities?
| City | 2024 Population | 4-Year Growth |
|---|---|---|
| Surprise | 167,564 | 16.0% |
| Gilbert | 288,790 | 7.2% |
| Yuma | 103,559 | 6.4% |
| Peoria | 199,924 | 4.1% |
| Phoenix | 1,673,164 | 3.8% |
| Glendale | 258,143 | 3.7% |
Yuma’s 6.4% growth outpaces Phoenix, Peoria, and Glendale. Only Surprise and Gilbert are growing faster. Steady population gains put upward pressure on housing demand, especially in a market with just three ZIP codes worth of inventory to absorb new arrivals.
Yuma Housing Market Trends
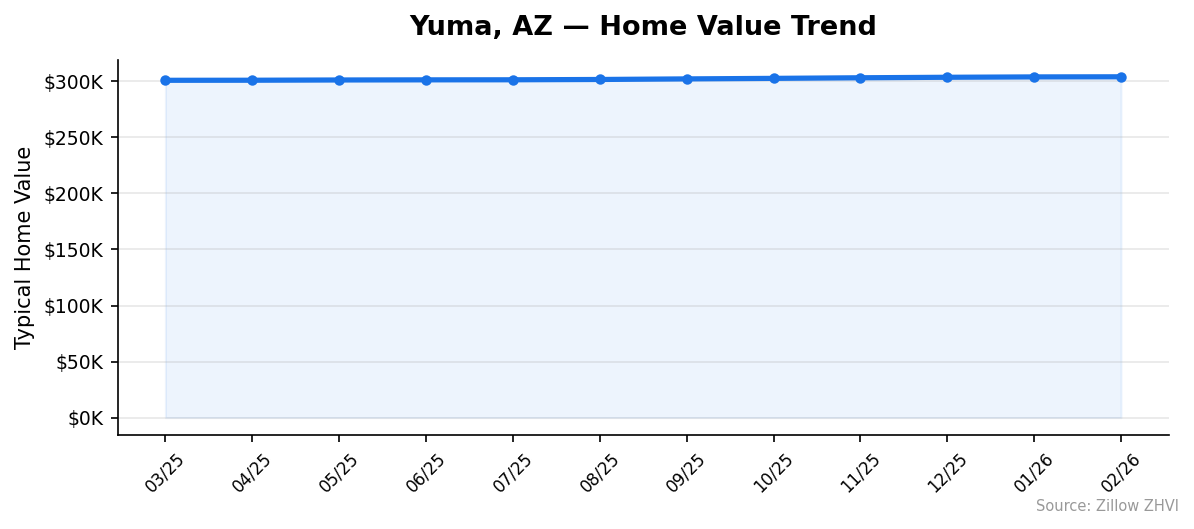
The 12-month trend shows a market that barely paused:
| Month | Average Price | Low | High |
|---|---|---|---|
| Mar 2025 | $300,959 | $260,818 | $324,256 |
| Apr 2025 | $301,020 | $260,816 | $324,184 |
| May 2025 | $301,244 | $261,020 | $324,308 |
| Jun 2025 | $301,361 | $261,157 | $324,349 |
| Jul 2025 | $301,422 | $261,438 | $324,288 |
| Aug 2025 | $301,693 | $261,786 | $324,564 |
| Sep 2025 | $302,221 | $262,126 | $325,150 |
| Oct 2025 | $302,687 | $262,184 | $325,787 |
| Nov 2025 | $303,229 | $262,302 | $326,570 |
| Dec 2025 | $303,661 | $262,430 | $327,320 |
| Jan 2026 | $303,987 | $262,614 | $327,998 |
| Feb 2026 | $304,094 | $262,766 | $328,382 |
Every single month posted a gain. Not one dip. The climb is gentle — roughly $260 per month on average — but the consistency is striking. From March 2025 to February 2026, the median rose $3,135 total.
The pace picked up slightly in the second half. September through February averaged about $310 per month in gains, compared to $230 per month from March through August.
Is Yuma a Good Place to Buy in 2026?
The data paints a straightforward picture. Prices are stable and rising slowly. You’re not chasing a runaway market, and you’re not catching a falling knife.
At $304K, Yuma remains affordable relative to the Phoenix metro, where median prices run significantly higher. The population is growing at 6.4%, which supports long-term demand. Rents and mortgage payments are close enough that ownership makes sense if you plan to stay several years.
The risk? A 1% annual gain barely keeps pace with inflation. You’re not going to build wealth quickly through appreciation alone. Yuma is a buy-and-hold market, not a flip market.
If you’re relocating for work or lifestyle and plan to stay 5+ years, the numbers work. If you’re looking for rapid appreciation, the trend data doesn’t support that expectation.
Yuma Housing Market Outlook for 2026-2027
The 12-month trend shows zero months of decline. That kind of consistency usually doesn’t reverse overnight.
If the current pace continues — roughly $260 to $310 per month — the median could drift toward $307,000 to $308,000 by mid-2026. The second-half acceleration suggests momentum is building, not fading.
Population growth adds a tailwind. An extra 1,500 to 2,000 residents per year need housing, and Yuma’s limited geographic footprint constrains new supply.
The 3-month trend from December through February averaged about $216 per month in gains, a slight deceleration from the fall pace. That could signal a plateau forming, or it could just be seasonal softness. Either way, a major correction seems unlikely given how steady the past year has been.
Similar Markets in AZ
If you’re shopping across Arizona, these cities offer useful comparisons:
- Chandler — A larger Phoenix suburb with higher price points than Yuma.
- Casa Grande — Another smaller Arizona market that may appeal to buyers priced out of the Phoenix metro.
- Tucson — Arizona’s second-largest city, offering a wider range of neighborhoods and price tiers.
- Surprise — The fastest-growing city on this list at 16% population growth, worth watching for demand trends.
- Peoria — A Phoenix suburb growing at 4.1%, comparable to Yuma’s growth trajectory.
Frequently Asked Questions
What is the average home price in Yuma?
The average home price in Yuma is $304,094 as of February 2026. Prices across the city’s three tracked ZIP codes range from $262,766 in the 85364 area to $328,382 in 85365.
Are home prices going up or down in Yuma?
Prices are going up. Yuma’s median home value increased 1.0% year over year. Every month in the past 12 posted a gain, with no declines recorded between March 2025 and February 2026.
Is it cheaper to rent or buy in Yuma?
Renting is slightly cheaper on a pure monthly payment basis. The average rent across Yuma is about $1,494, while an estimated mortgage payment on the median home is roughly $1,618. The gap narrows in ZIP 85367, where rent and mortgage costs differ by only $78 per month.
What is the most affordable neighborhood in Yuma?
ZIP code 85364 is the most affordable at $262,766 — about $41,000 below the city median. Rent in this area averages $1,214 per month, also the lowest in the city.
Methodology
Home values are based on the Zillow Home Value Index (ZHVI), a smoothed measure of typical home values in the 35th to 65th percentile range. Rent estimates use the Zillow Observed Rent Index (ZORI). Population figures come from the U.S. Census Bureau Population Estimates Program (2020-2024 vintage). All datasets are publicly available. Housing data updated 2026-02-28.