Casa Grande Home Prices: $337K, Down 0.4% — 3 ZIPs Analyzed (2026)
$337K. That’s what a typical home costs in Casa Grande right now — and prices have barely moved in a year. For a city that added nearly 15,000 residents since 2020, that kind of price stability is unusual.
Quick answer: The average home price in Casa Grande, AZ is $336,728 as of February 2026, down 0.4% year over year according to Zillow.
Current Home Prices in Casa Grande
The median home value sits at $336,728. That’s a 0.4% decline compared to the same month last year — a near-flat reading that puts Casa Grande in neutral territory.
| Metric | Value |
|---|---|
| Median Home Value | $336,728 |
| Year-over-Year Change | -0.4% |
| Lowest ZIP Median | $307,845 |
| Highest ZIP Median | $359,879 |
| Number of ZIPs Tracked | 3 |
| Data As Of | February 2026 |
The $52,034 spread between the cheapest and most expensive ZIP codes means your neighborhood choice matters. A buyer targeting the lowest-priced ZIP saves roughly $29,000 compared to the city average.
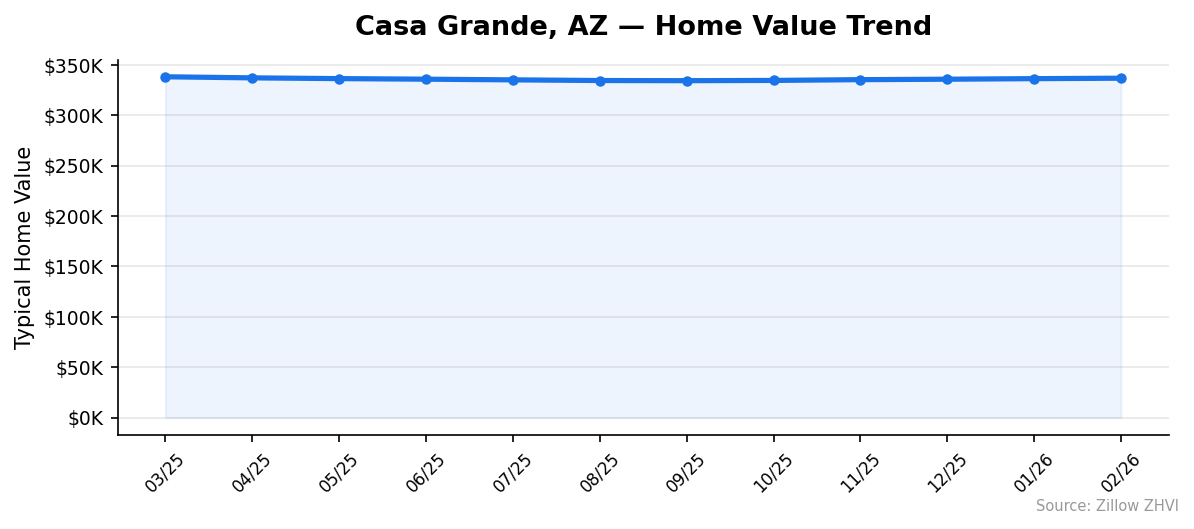
That -0.4% annual change deserves context. It’s not a crash. It’s not a boom. Prices have hovered in a narrow band for the past year, with the city-wide average bouncing between $334,265 and $338,128. If you’re waiting for a big dip, the data doesn’t support that expectation.
Casa Grande Home Prices by Neighborhood
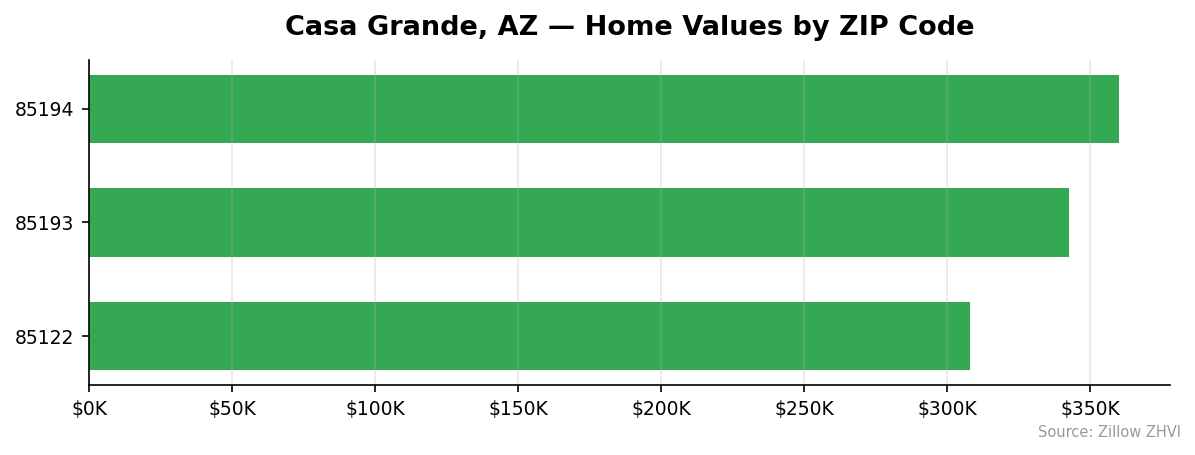
All three tracked ZIP codes in Casa Grande show meaningful price differences.
| ZIP Code | Median Home Value | vs. City Average |
|---|---|---|
| 85194 | $359,879 | +$23,151 |
| 85193 | $342,461 | +$5,733 |
| 85122 | $307,845 | -$28,883 |
Most Expensive
85194 tops the list at $359,879 — nearly 7% above the city median. This is Casa Grande’s premium ZIP.
Most Affordable
85122 comes in at $307,845, a full $52,034 less than the priciest ZIP. It’s also the only area with rent tracking data, with a typical rent of $1,512 per month. For buyers on a budget, 85122 offers the lowest entry point in the city.
85193 sits in the middle at $342,461 — close to the city average and a reasonable compromise between the two extremes.
Rent vs Buy in Casa Grande
Rent data is available for one ZIP code: 85122, where the typical rent is $1,512 per month.
Here’s a rough comparison. A 30-year mortgage on a $307,845 home (the 85122 median) with 10% down and a 7% rate runs about $1,840 per month in principal and interest alone. Add property taxes and insurance, and you’re looking at roughly $2,200 or more.
| Monthly Cost | Amount |
|---|---|
| Typical Rent (85122) | $1,512 |
| Estimated Mortgage Payment | ~$2,200+ |
| Monthly Difference | ~$688 |
Renting saves you about $688 per month on cash flow. But that doesn’t account for equity. Over time, a portion of each mortgage payment builds ownership. Whether the math favors buying depends on how long you plan to stay and where you think prices are headed.
For the city-wide median of $336,728, the mortgage math gets worse. Monthly payments climb past $2,400, making the rent-vs-buy gap even wider.
Rent data is not yet available for ZIP codes 85193 and 85194.
Population Growth and Migration
Casa Grande is one of the fastest-growing cities in Arizona. The numbers tell the story.
| Year | Population |
|---|---|
| 2020 | 54,126 |
| 2021 | 57,429 |
| 2022 | 60,109 |
| 2023 | 64,027 |
| 2024 | 68,927 |
That’s a 27.3% jump in four years — from 54,126 to 68,927 residents. The city added roughly 3,700 people per year on average.
How does that compare to other Arizona cities?
| City | 2024 Population | 4-Year Growth |
|---|---|---|
| Casa Grande | 68,927 | 27.3% |
| Surprise | 167,564 | 16.0% |
| Gilbert | 288,790 | 7.2% |
| Peoria | 199,924 | 4.1% |
| Phoenix | 1,673,164 | 3.8% |
| Glendale | 258,143 | 3.7% |
Casa Grande’s growth rate dwarfs every comparison city. It’s growing nearly twice as fast as Surprise, the next closest. This kind of population influx puts upward pressure on housing demand, which makes the flat price trend even more notable. New construction may be absorbing much of that demand.
Casa Grande Housing Market Trends
Here’s how the city-wide median moved month by month over the past year.
| Month | Average Median | Low ZIP | High ZIP |
|---|---|---|---|
| Mar 2025 | $338,128 | $317,321 | $361,599 |
| Apr 2025 | $337,063 | $315,711 | $359,854 |
| May 2025 | $336,325 | $314,279 | $358,449 |
| Jun 2025 | $335,751 | $312,780 | $357,358 |
| Jul 2025 | $335,082 | $311,278 | $356,509 |
| Aug 2025 | $334,427 | $309,945 | $355,800 |
| Sep 2025 | $334,265 | $309,116 | $355,606 |
| Oct 2025 | $334,528 | $308,480 | $356,155 |
| Nov 2025 | $335,281 | $308,110 | $357,486 |
| Dec 2025 | $335,727 | $307,770 | $358,537 |
| Jan 2026 | $336,277 | $307,709 | $359,441 |
| Feb 2026 | $336,728 | $307,845 | $359,879 |
The pattern is clear. Prices slid from a March 2025 peak of $338,128 down to a September 2025 trough of $334,265 — a $3,863 decline. Then they reversed. Since September, the median has climbed $2,463 over five consecutive months.
Notice something interesting in the ZIP-level data: the cheapest ZIP (85122) kept dropping even as the city average rose. It went from $317,321 in March 2025 to $307,845 in February 2026 — a $9,476 decline. The most expensive ZIP did the opposite, recovering to $359,879 from a low of $355,606. The gap between Casa Grande’s cheapest and priciest neighborhoods is widening.
Is Casa Grande a Good Place to Buy in 2026?
The data points to a balanced market. Prices are essentially flat year over year (-0.4%), which means neither buyers nor sellers have a strong upper hand.
Buyers benefit from price stability. You’re not chasing a runaway market. The median has stayed within a $4,000 range for 12 months. That gives you time to shop without fear of being priced out next month.
The population growth rate — 27.3% in four years — signals sustained demand. People are moving here. That’s a floor under prices.
If you’re buying in 85122, the declining trend in that ZIP means you may find better deals than six months ago. If you’re targeting 85194, prices are firming up. Pick your neighborhood carefully because the ZIPs are moving in different directions.
Casa Grande Housing Market Outlook for 2026-2027
The five-month upward trend since September 2025 suggests prices have found a floor and are slowly recovering. If the current pace continues — roughly $490 per month in gains — the city-wide median could cross $340,000 by mid-2026.
But don’t expect a sharp spike. The year-over-year number is still negative, and the gains are modest. The 12-month trend looks more like a gentle U-shape than a V-shaped recovery.
The population story is the wild card. Nearly 15,000 new residents in four years creates real demand. If new construction slows or mortgage rates drop, that demand could push prices higher. The three-month trend suggests steady, incremental appreciation rather than a breakout in either direction.
Similar Markets in AZ
If you’re comparing options across Arizona, here are a few cities worth checking:
- Phoenix — The metro anchor with a much larger market and higher price points than Casa Grande.
- Mesa — East Valley alternative that’s closer to Phoenix employment centers.
- Tucson — Southern Arizona’s largest city, often cheaper than the Phoenix metro.
- Surprise — Another fast-growing suburb with a 16% population gain since 2020.
- Yuma — For buyers looking at the most affordable end of the Arizona market.
Frequently Asked Questions
What is the average home price in Casa Grande?
The average home price in Casa Grande is $336,728 as of February 2026. Across the city’s three tracked ZIP codes, prices range from $307,845 in ZIP 85122 to $359,879 in ZIP 85194.
Are home prices going up or down in Casa Grande?
Prices are down 0.4% year over year — essentially flat. However, the monthly trend shows prices have been rising since September 2025, gaining about $2,463 over five months. The annual number is negative, but the recent direction is upward.
Is it cheaper to rent or buy in Casa Grande?
Renting is cheaper on a monthly basis. In ZIP 85122, the typical rent is $1,512 per month. A mortgage on the same area’s median home would cost roughly $2,200 or more per month. That’s a $688 gap favoring renters on cash flow alone, though buying builds equity over time.
What is the most affordable neighborhood in Casa Grande?
ZIP code 85122 is the most affordable at $307,845 — about $29,000 below the city-wide median. It’s also the only ZIP with tracked rent data, making it easier to evaluate the full cost of living there.
Methodology
Home values are based on the Zillow Home Value Index (ZHVI), a smoothed measure of typical home values in the 35th to 65th percentile range. Rent estimates use the Zillow Observed Rent Index (ZORI). Population figures come from the U.S. Census Bureau Population Estimates Program (2020-2024 vintage). All datasets are publicly available. Housing data updated 2026-02-28.