Tucson Home Prices: $361K, Down 1.8% — 26 ZIPs Analyzed (2026)
$361,474. That’s what a typical home costs in Tucson right now — and it’s less than it was a year ago. The median has slipped 1.8% year over year, continuing a slow decline that started in spring 2025. For buyers who’ve been waiting on the sidelines, the numbers are finally moving in their direction.
Quick answer: The average home price in Tucson, AZ is $361,474 as of February 2026, down 1.8% year over year according to Zillow.
Current Home Prices in Tucson
| Metric | Value |
|---|---|
| Median Home Value | $361,474 |
| Year-over-Year Change | -1.8% |
| Lowest ZIP Median | $230,901 |
| Highest ZIP Median | $728,493 |
| ZIP Codes Tracked | 26 |
| Data as of | February 2026 |
The spread between the cheapest and most expensive ZIP codes is nearly $500,000. That gap tells you Tucson is not one market — it’s at least a dozen. You can buy a starter home south of downtown for under $240,000 or pay three times that in the foothills near Sabino Canyon.
The 1.8% decline may not sound like much, but it adds up. On a $368,000 home (last year’s peak), that’s roughly $6,500 in lost value. Sellers who bought at the top in early 2025 are already underwater on transaction costs if they tried to sell today.
Month-to-month changes have been small — the market isn’t crashing. It’s deflating slowly, losing a few hundred dollars per month since summer 2025.
Tucson Home Prices by Neighborhood
| ZIP Code | Median Home Value | Typical Rent |
|---|---|---|
| 85718 | $728,493 | $1,512 |
| 85749 | $638,924 | $1,745 |
| 85750 | $595,725 | $1,367 |
| 85704 | $440,203 | $1,372 |
| 85701 | $398,826 | $1,476 |
| 85743 | $394,878 | $1,768 |
| 85742 | $384,519 | $1,793 |
| 85715 | $375,455 | $1,598 |
| 85748 | $372,241 | Data not available for this metric. |
| 85747 | $362,994 | $1,884 |
| 85745 | $356,932 | $1,416 |
| 85735 | $341,479 | Data not available for this metric. |
| 85719 | $334,973 | $1,322 |
| 85741 | $322,250 | $1,601 |
| 85757 | $321,380 | $1,916 |
| 85716 | $310,901 | $1,214 |
| 85756 | $305,095 | $1,934 |
| 85710 | $296,820 | $1,164 |
| 85730 | $286,162 | $1,614 |
| 85746 | $283,836 | $1,258 |
| 85712 | $281,761 | $1,093 |
| 85711 | $280,021 | $1,261 |
| 85706 | $260,993 | $1,143 |
| 85705 | $253,817 | $1,075 |
| 85713 | $238,751 | $1,357 |
| 85714 | $230,901 | $983 |
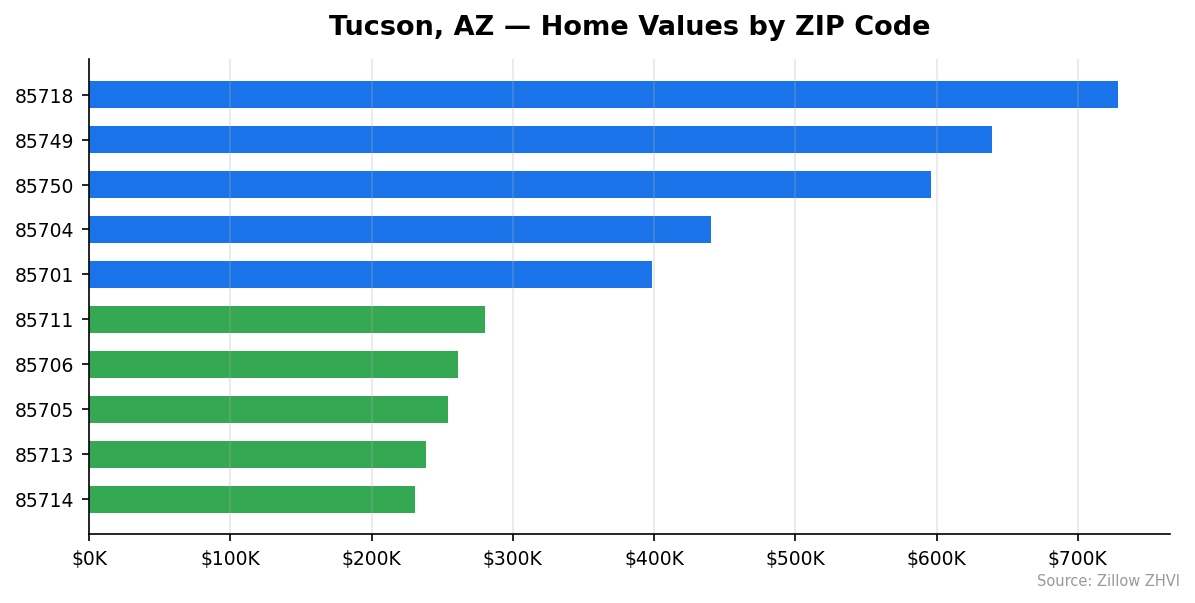
Most Expensive ZIPs
85718 leads at $728,493 — more than double the city median. This is the Catalina Foothills area, where homes come with mountain views and price tags to match. Despite sky-high values, rents here are a moderate $1,512, suggesting most residents are owners, not tenants.
85749 comes in at $638,924 with rents around $1,745. This is the far east side near Saguaro National Park, where newer construction and larger lots drive prices well above average.
85750 rounds out the top three at $595,725. Rents are actually lower here than in 85749 at $1,367, which means the price-to-rent ratio is stretched — buyers are paying a premium relative to what renters pay.
Most Affordable ZIPs
85714 is the cheapest at $230,901 — 36% below the city median. Rents here are also the lowest at $983 per month, making it the most affordable corner of Tucson by either measure.
85713 sits at $238,751 but has rents of $1,357, well above what you’d expect for its home values. That disconnect could signal rental demand from people priced out of buying in this area.
85705 rounds out the bottom three at $253,817 with $1,075 rents. This northwest-of-downtown area offers entry-level pricing for buyers willing to trade location for affordability.
Rent vs Buy in Tucson
The math depends heavily on which ZIP code you’re looking at, but here’s a rough calculation for the city median.
| Scenario | Monthly Cost |
|---|---|
| Median Home Mortgage (20% down, 7% rate, 30yr) | ~$1,923 |
| Property Tax + Insurance (estimated) | ~$400 |
| Total Monthly Ownership Cost | ~$2,323 |
| Typical City Rent Range | $983–$1,934 |
On a $361,474 home with 20% down, you’re financing about $289,179. At a 7% interest rate, principal and interest alone run roughly $1,923 per month. Add property taxes and insurance and you’re north of $2,300.
Most ZIP codes have typical rents between $1,100 and $1,800. That’s a $500–$1,200 gap between renting and owning on a monthly basis.
The exceptions are interesting. In 85756, rents hit $1,934 on homes valued at $305,095. In 85757, rents are $1,916 on $321,380 homes. These southeast-side ZIPs have unusually high rents relative to home values, which could make buying more attractive there than in the rest of the city.
On the flip side, 85718 has $728,493 homes but only $1,512 rents. You’d need roughly $3,900 per month to own there. Renting saves you $2,400 a month in that ZIP.
For most Tucson buyers, renting is cheaper on a monthly basis. But if you’re looking at the more affordable south-side ZIPs, the gap narrows enough that building equity starts to make sense.
Population Growth and Migration
Tucson had 554,013 residents in 2024. The city has grown 2.1% since the 2020 Census, adding about 11,400 people over four years.
| Year | Population |
|---|---|
| 2020 | 542,649 |
| 2021 | 541,283 |
| 2022 | 547,476 |
| 2023 | 549,932 |
| 2024 | 554,013 |
The trajectory wasn’t smooth. Tucson actually lost about 1,400 residents in 2021 before bouncing back with a 6,200-person gain in 2022. Growth has been steady since then — roughly 2,500 new residents each year.
How does Tucson compare to other Arizona cities?
| City | 2024 Population | 4-Year Growth |
|---|---|---|
| Phoenix | 1,673,164 | 3.8% |
| Gilbert | 288,790 | 7.2% |
| Peoria | 199,924 | 4.1% |
| Surprise | 167,564 | 16.0% |
| Goodyear | 118,186 | 20.8% |
| Tucson | 554,013 | 2.1% |
Tucson’s 2.1% growth is the slowest on this list. Outer Phoenix suburbs like Goodyear (20.8%) and Surprise (16.0%) are absorbing far more newcomers. That slower growth rate is one reason Tucson’s housing prices face less upward pressure than the Phoenix metro — demand isn’t overwhelming supply the way it is in those boom towns.
Still, the city is gaining residents, not losing them. Steady 2,500-person annual gains mean continued baseline demand for housing.
Tucson Housing Market Trends
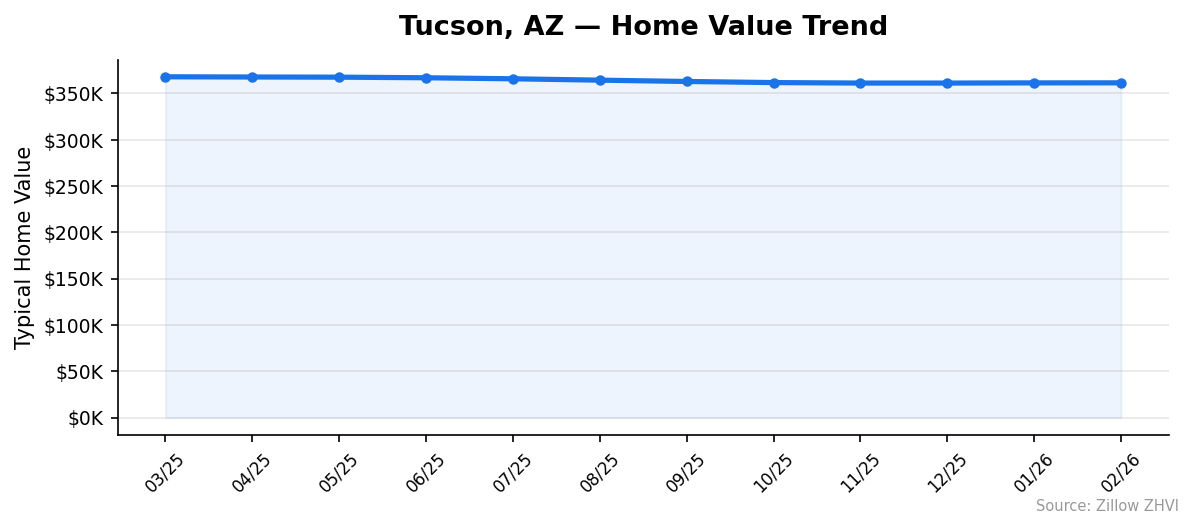
Here’s how the median home value has moved over the past 12 months.
| Month | Median Value | Low | High |
|---|---|---|---|
| Feb 2026 | $361,474 | $230,901 | $728,493 |
| Jan 2026 | $361,417 | $231,011 | $728,371 |
| Dec 2025 | $361,227 | $231,322 | $726,972 |
| Nov 2025 | $361,234 | $231,801 | $726,093 |
| Oct 2025 | $361,741 | $232,966 | $726,498 |
| Sep 2025 | $362,949 | $234,534 | $729,417 |
| Aug 2025 | $364,361 | $236,544 | $732,094 |
| Jul 2025 | $365,840 | $238,377 | $734,338 |
| Jun 2025 | $366,953 | $240,018 | $734,850 |
| May 2025 | $367,600 | $240,746 | $733,960 |
| Apr 2025 | $367,774 | $240,645 | $731,616 |
| Mar 2025 | $368,000 | $240,040 | $729,943 |
The pattern is clear: prices peaked in March 2025 at $368,000 and have drifted lower every month since. The total decline is $6,526 — about 1.8% over 12 months.
The rate of decline has slowed. From March to September 2025, the median dropped roughly $5,000. From September to February 2026, it dropped only $1,475. The market may be finding a floor somewhere around $361,000.
The bottom of the market has dropped faster than the top. The cheapest ZIP went from $240,040 in March 2025 to $230,901 in February 2026 — a $9,139 decline, or 3.8%. Meanwhile the most expensive ZIP barely budged, going from $729,943 to $728,493. Price declines are hitting affordable neighborhoods harder.
Is Tucson a Good Place to Buy in 2026?
The data points toward a buyer’s market, but a mild one.
Prices are falling. They’ve declined for 11 consecutive months. That gives you negotiating power. Sellers who listed at 2025 peak prices are likely adjusting expectations downward.
The 26 ZIP codes tracked here range from $231,000 to $728,000. That wide spread means entry points exist at every budget. If you earn the Tucson metro median income, the south-side ZIPs in the $230,000–$260,000 range are where the math works best.
Population growth is positive but slow at 2.1% over four years. That’s not the kind of demand surge that would push prices back up quickly. Tucson isn’t Goodyear or Surprise. It’s growing at a measured pace.
The risk? If mortgage rates drop significantly, pent-up demand could push prices back up. But based on the current trajectory, buyers have time. The market is cooling, not collapsing. That’s the best environment for making a deliberate purchase rather than a panicked one.
Tucson Housing Market Outlook for 2026-2027
The 3-month trend from December 2025 to February 2026 shows near-flat movement — the median ticked up by just $247 over that stretch. Compare that to the $5,000 drops seen between April and September 2025.
If the current pace continues, Tucson prices are likely to hover in the $359,000–$363,000 range through mid-2026. The downward momentum has largely stalled. We’re looking at a plateau, not a continued slide.
The seasonal pattern matters. Prices typically firm up in spring and summer as buying activity increases. If that pattern holds, the median could edge back toward $363,000–$365,000 by July 2026 before easing again in fall.
Don’t expect a sharp rebound. With population growing at only 2,500 people per year and the Phoenix suburbs absorbing most of Arizona’s in-migration, Tucson lacks the demand engine for rapid appreciation. The most likely scenario for 2026–2027 is sideways movement with a slight downward bias.
Similar Markets in AZ
If you’re considering Tucson, these Arizona cities offer different price points and growth profiles.
- Phoenix — Arizona’s largest market with 3.8% population growth. Expect higher price competition than Tucson.
- Mesa — East Valley alternative with more suburban character and strong access to Phoenix jobs.
- Casa Grande — Halfway between Tucson and Phoenix, often cheaper than both. Worth a look if you commute.
- Chandler — Tech-heavy employment base east of Phoenix. Higher prices but strong rental demand.
- Tempe — University town with a younger demographic and tighter inventory near ASU.
Frequently Asked Questions
What is the average home price in Tucson?
The median home value in Tucson is $361,474 as of February 2026. This figure represents typical homes in the 35th to 65th percentile range. Prices across the city’s 26 tracked ZIP codes range from $230,901 to $728,493.
Are home prices going up or down in Tucson?
Prices are going down. The median has fallen 1.8% year over year, declining from $368,000 in March 2025 to $361,474 in February 2026. The rate of decline has slowed in recent months, suggesting the market may be stabilizing near current levels.
Is it cheaper to rent or buy in Tucson?
Renting is cheaper on a monthly basis for most Tucson ZIP codes. A mortgage on the median-priced home runs roughly $1,923 per month before taxes and insurance, while typical rents range from $983 to $1,934. The gap is smallest in southeast ZIPs like 85756 and 85757, where rents approach $1,900.
What is the most affordable neighborhood in Tucson?
ZIP code 85714 has the lowest median home value at $230,901 — about 36% below the city average. It also has the lowest typical rent at $983 per month. The next most affordable options are 85713 ($238,751) and 85705 ($253,817).
Methodology
Home values are based on the Zillow Home Value Index (ZHVI), a smoothed measure of typical home values in the 35th to 65th percentile range. Rent estimates use the Zillow Observed Rent Index (ZORI). Population figures come from the U.S. Census Bureau Population Estimates Program (2020-2024 vintage). All datasets are publicly available. Housing data updated 2026-02-28.