Arlington Home Prices: $325K, Down 2.3% — 12 ZIPs Analyzed (2026)
$325,086. That’s what a typical home costs in Arlington right now — down 2.3% from a year ago. In a metro where Fort Worth and Dallas grab most of the headlines, Arlington sits in the middle of the DFW sprawl with prices that have been quietly sliding since spring 2025.
Quick answer: The average home price in Arlington, TX is $325,086 as of February 2026, down 2.3% year over year according to Zillow.
Current Home Prices in Arlington
Arlington’s median home value sits well below the DFW metro’s priciest pockets but remains above the statewide median for Texas. Here’s where things stand:
| Metric | Value |
|---|---|
| Median home price | $325,086 |
| Year-over-year change | -2.3% |
| Lowest ZIP value | $229,614 |
| Highest ZIP value | $544,332 |
| Number of ZIPs tracked | 12 |
| Data as of | February 2026 |
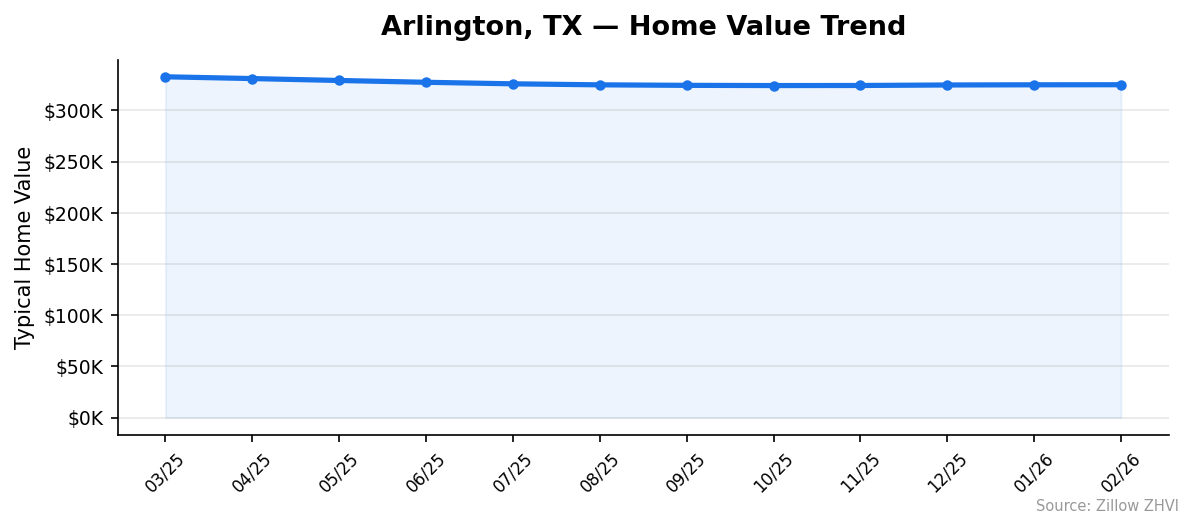
The 2.3% annual drop works out to roughly $7,600 in lost equity on the median home. That’s not a crash, but it continues a downward trend that started around March 2025 when the city-wide average hit $332,838.
The spread between the cheapest and most expensive ZIP codes is wide — $314,718 separates them. That gap tells you Arlington is not one housing market. It’s several, stacked on top of each other.
Buyers shopping today have more breathing room than they did a year ago. Sellers need to price carefully.
Arlington Home Prices by Neighborhood
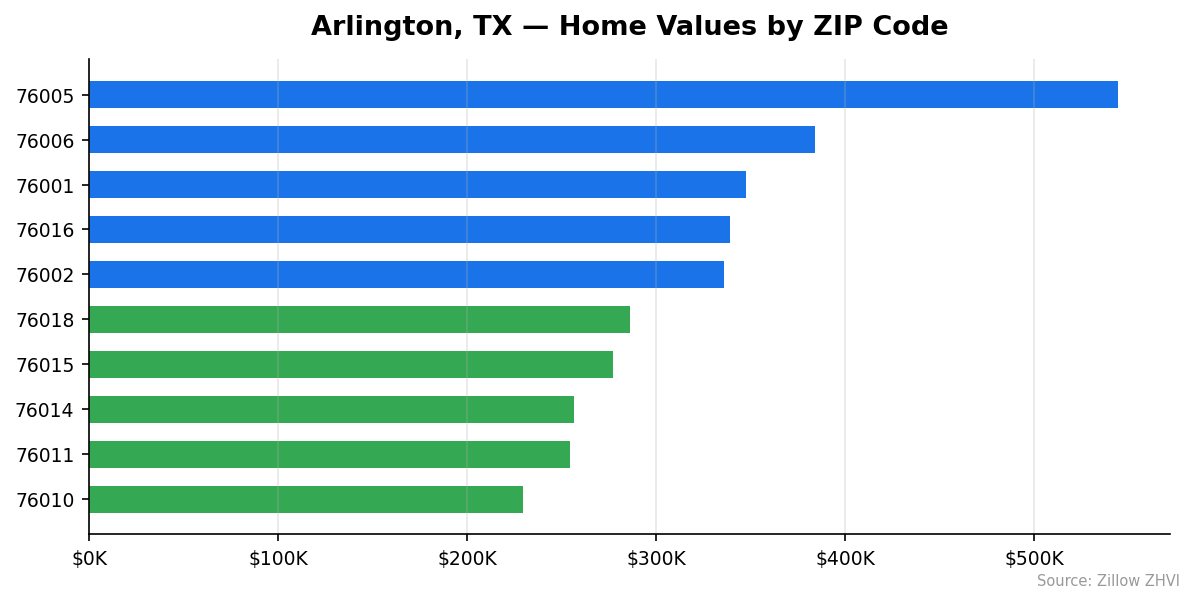
All 12 Arlington ZIP codes show meaningful price differences. Here’s the full breakdown:
| ZIP Code | Median Home Value | Avg. Monthly Rent |
|---|---|---|
| 76005 | $544,332 | $1,642 |
| 76006 | $383,915 | $1,165 |
| 76001 | $347,710 | $2,064 |
| 76016 | $339,255 | $1,591 |
| 76002 | $336,044 | $2,294 |
| 76012 | $334,208 | $1,478 |
| 76017 | $312,164 | $2,030 |
| 76018 | $286,071 | $2,043 |
| 76015 | $276,850 | $1,614 |
| 76014 | $256,350 | $1,645 |
| 76011 | $254,520 | $1,361 |
| 76010 | $229,614 | $1,235 |
Most Expensive ZIPs
76005 leads Arlington at $544,332 — 67% above the city median, though rents here run a moderate $1,642/month, suggesting larger or newer owner-occupied homes.
76006 comes in at $383,915 with the lowest average rent in the city at $1,165/month — an unusual combo of high home values and low rents that points to an established, owner-heavy neighborhood.
76001 rounds out the top three at $347,710 with rents of $2,064/month, the third-highest rent figure in Arlington.
Most Affordable ZIPs
76010 is Arlington’s entry point at $229,614 with matching low rents of $1,235/month. If you’re budget-conscious, start here.
76011 follows at $254,520 with rents of $1,361/month — both figures sit roughly 22% below the city average.
76014 at $256,350 offers similar affordability, though rents are higher at $1,645/month, which narrows the gap between owning and renting in this area.
Rent vs Buy in Arlington
Renting is cheaper on paper. Across all 12 ZIP codes, the average monthly rent comes to roughly $1,680.
A mortgage on the median $325,086 home tells a different story. With 20% down ($65,017), you’d finance $260,069. At a 7% rate on a 30-year fixed loan, the principal and interest alone run about $1,730/month. Add Texas property taxes — which average around 2.2% — and homeowner’s insurance, and you’re looking at roughly $2,300 to $2,500 per month in total housing costs.
That’s $600 to $800 more than renting each month.
| Cost | Monthly Estimate |
|---|---|
| Average rent (all ZIPs) | ~$1,680 |
| Mortgage P&I (20% down, 7%) | ~$1,730 |
| Est. property tax + insurance | ~$600 |
| Total ownership cost | ~$2,330 |
The math favors renting in the short term. But with prices down 2.3% and mortgage rates potentially easing, buyers who plan to stay 5+ years may find the gap closes over time through equity building.
One quirk in the data: ZIP 76002 has rents of $2,294/month with home values of $336,044. Buying might actually make more sense there than in most of the city.
Population Growth and Migration
Arlington’s population hit 403,672 in 2024, up 2.4% from 394,380 in 2020. The city is growing, though not as fast as some Texas peers.
| Year | Population |
|---|---|
| 2020 | 394,380 |
| 2021 | 393,559 |
| 2022 | 395,943 |
| 2023 | 401,203 |
| 2024 | 403,672 |
Notice the dip in 2021 — Arlington briefly lost residents during the pandemic before rebounding. Growth accelerated from 2022 onward, adding over 7,700 people in the 2023-2024 period alone.
How does that compare to other Texas cities?
| City | 2024 Population | 4-Year Growth |
|---|---|---|
| Fort Worth | 1,008,106 | 9.1% |
| San Antonio | 1,526,656 | 6.1% |
| Lubbock | 272,086 | 5.4% |
| Houston | 2,390,125 | 4.0% |
| Austin | 993,588 | 2.9% |
| Arlington | 403,672 | 2.4% |
Arlington trails every city on this list in growth rate. Fort Worth — its neighbor — is growing nearly four times faster. That slower growth partially explains why Arlington’s home prices are softening while other Texas metros hold firm. Demand isn’t surging the way it is next door.
Arlington Housing Market Trends
Here’s how the median home value moved over the past 12 months:
| Month | Median Value | Min ZIP | Max ZIP |
|---|---|---|---|
| Feb 2026 | $325,086 | $229,614 | $544,332 |
| Jan 2026 | $325,017 | $229,516 | $544,510 |
| Dec 2025 | $324,836 | $229,206 | $544,211 |
| Nov 2025 | $324,343 | $228,754 | $542,450 |
| Oct 2025 | $324,272 | $229,082 | $540,922 |
| Sep 2025 | $324,483 | $229,575 | $539,496 |
| Aug 2025 | $324,979 | $229,641 | $540,160 |
| Jul 2025 | $325,968 | $229,800 | $542,389 |
| Jun 2025 | $327,471 | $230,428 | $545,849 |
| May 2025 | $329,232 | $231,823 | $548,169 |
| Apr 2025 | $331,102 | $233,391 | $549,532 |
| Mar 2025 | $332,838 | $234,870 | $550,324 |
The pattern is clear. Prices fell steadily from March 2025 ($332,838) through October 2025 ($324,272) — a $8,566 drop over seven months. Since then, values have flatlined with a very slight uptick. The February figure of $325,086 is only $814 above the October bottom.
The floor ZIP (76010) has been remarkably stable, hovering between $228,754 and $234,870 all year. The ceiling ZIP (76005) has shown more movement, dropping from $550,324 to $544,332.
Is Arlington a Good Place to Buy in 2026?
The data points to a buyer’s market. Prices are down year over year, inventory pressure from slower population growth gives buyers more room to negotiate, and the month-over-month declines have stabilized rather than accelerated.
Three factors work in a buyer’s favor right now. First, the 2.3% annual decline means sellers are already adjusting expectations. Second, the price floor appears to be forming — four consecutive months of near-flat values suggest the slide is losing momentum. Third, the wide price range ($229K to $544K) means options exist at multiple budget levels.
The risk? Arlington’s 2.4% population growth lags behind DFW neighbors. If that trend continues, price appreciation may stay muted even after the market stabilizes.
For buyers who plan to stay 5+ years and can find the right ZIP code, the current dip offers a window. Short-term flippers should look elsewhere.
Arlington Housing Market Outlook for 2026-2027
The three-month trend from December 2025 through February 2026 shows prices inching up by about $250 over that span. That’s effectively flat.
If this pace holds, expect Arlington’s median to hover in the $324,000 to $327,000 range through mid-2026. A return to the $332K levels of early 2025 looks unlikely without a significant drop in mortgage rates or a surge in demand.
The spring buying season could push prices up modestly — seasonal patterns typically bring more buyers into the market between April and June. But with year-over-year numbers still negative, any spring bump would likely be measured in hundreds of dollars, not thousands.
Watch the October-to-February stabilization pattern. If prices hold above $325K through summer, the year-over-year decline will narrow simply because the 2025 comparison period was also falling. By late 2026, Arlington could be printing flat or slightly positive YoY numbers even without meaningful price gains.
Similar Markets in TX
If you’re weighing Arlington against other Texas cities, here are a few to compare:
- Houston — Texas’s largest city with 4.0% population growth, a useful benchmark for urban pricing.
- Grand Prairie — Arlington’s immediate neighbor in the DFW mid-cities corridor.
- Dallas — The metro anchor, typically priced higher than Arlington.
- San Antonio — Growing at 6.1% with a different affordability profile than DFW.
- El Paso — West Texas option for buyers seeking lower price points.
Frequently Asked Questions
What is the average home price in Arlington?
The average home price in Arlington, TX is $325,086 as of February 2026. That figure represents the Zillow Home Value Index across all 12 tracked ZIP codes, with individual neighborhoods ranging from $229,614 to $544,332.
Are home prices going up or down in Arlington?
Down. Arlington home values dropped 2.3% year over year. The decline started around March 2025 and bottomed out near October 2025. Since then, prices have stabilized but remain below year-ago levels.
Is it cheaper to rent or buy in Arlington?
Renting is cheaper on a monthly basis. Average rents run about $1,680/month across Arlington, while total ownership costs on a median-priced home come to roughly $2,300/month or more when you factor in Texas property taxes and insurance.
What is the most affordable neighborhood in Arlington?
ZIP code 76010 has the lowest median home value at $229,614 — about 29% below the city-wide median. Rents there are also the lowest in Arlington at $1,235/month.
Methodology
Home values are based on the Zillow Home Value Index (ZHVI), a smoothed measure of typical home values in the 35th to 65th percentile range. Rent estimates use the Zillow Observed Rent Index (ZORI). Population figures come from the U.S. Census Bureau Population Estimates Program (2020-2024 vintage). All datasets are publicly available. Housing data updated 2026-02-28.