Baytown Home Prices: $265K, Flat 0% — 3 ZIPs Analyzed (2026)
$265,371. That’s what a typical home costs in Baytown, TX right now. Prices haven’t moved in a year — flat at 0.0% year-over-year change. For buyers watching the Houston metro, that stagnation could be an opening.
Quick answer: The average home price in Baytown, TX is $265,371 as of February 2026, unchanged (0.0%) year over year according to Zillow.
Current Home Prices in Baytown
Baytown sits in the Houston-The Woodlands-Sugar Land metro area. Here’s where prices stand:
| Metric | Value |
|---|---|
| Median Home Price | $265,371 |
| Year-over-Year Change | 0.0% |
| Lowest ZIP Median | $170,943 |
| Highest ZIP Median | $371,861 |
| Number of ZIPs Tracked | 3 |
| Data as of | February 2026 |
A $265K median puts Baytown well below the Houston metro’s typical price point. The $200K gap between the cheapest and most expensive ZIP codes means your experience depends heavily on where in the city you buy.
Zero percent growth is unusual. Most Texas cities have seen some movement — up or down — over the past year. Baytown has been remarkably still. That flat line tells you supply and demand are roughly in balance here.
Baytown Home Prices by Neighborhood
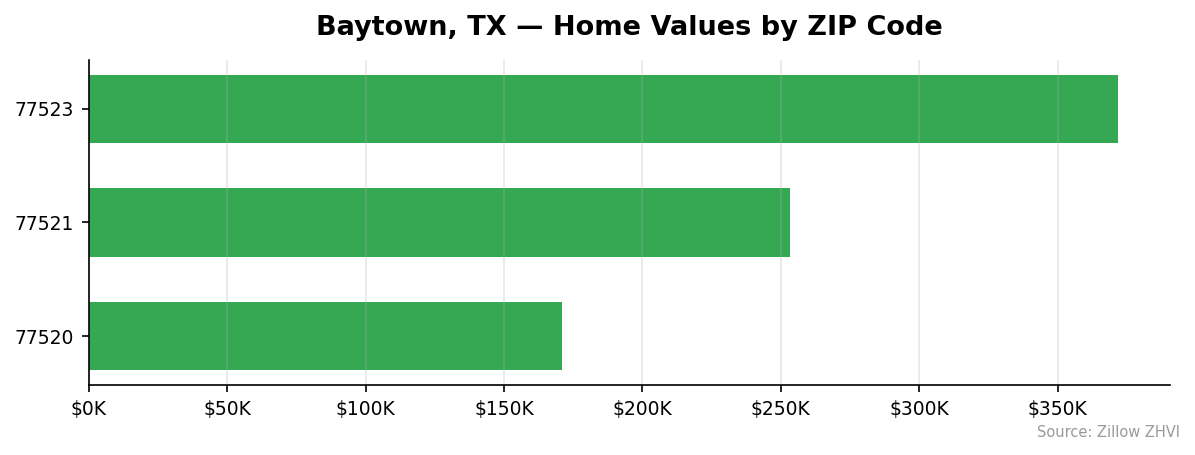
All three Baytown ZIP codes show significant price differences:
| ZIP Code | Median Home Value | Avg. Monthly Rent |
|---|---|---|
| 77520 | $170,943 | $1,268 |
| 77521 | $253,308 | $1,513 |
| 77523 | $371,861 | $2,237 |
Most Expensive
77523 tops the list at $371,861 — 40% above the city median. Rents here run $2,237/month, the highest in Baytown by a wide margin.
Most Affordable
77520 is Baytown’s budget option at $170,943, roughly 36% below the citywide median. Rent averages $1,268/month, making it the most accessible entry point for both renters and buyers.
77521 falls in the middle at $253,308 with $1,513/month rent. It tracks close to the city average.
Rent vs Buy in Baytown
Rent costs vary sharply across Baytown’s three ZIP codes:
| ZIP Code | Monthly Rent | Estimated Monthly Mortgage* |
|---|---|---|
| 77520 | $1,268 | ~$1,130 |
| 77521 | $1,513 | ~$1,670 |
| 77523 | $2,237 | ~$2,450 |
Estimated mortgage assumes 20% down, 6.5% rate, 30-year fixed. Property taxes and insurance not included.
In the cheapest ZIP (77520), buying wins on paper — the mortgage payment undercuts rent by over $100/month, and you build equity. But add property taxes and insurance in Harris County, and the gap narrows fast.
In 77523, the math tilts toward renting. A $2,450 mortgage payment before taxes and insurance on a $372K home adds up quickly. Renters at $2,237 keep more flexibility.
The middle ZIP (77521) is a toss-up. Monthly costs are close enough that your decision should come down to how long you plan to stay. Buying makes more sense if you’ll be there five years or more.
Population Growth and Migration
Baytown is growing, but barely.
| Year | Population |
|---|---|
| 2020 | 85,436 |
| 2021 | 84,417 |
| 2022 | 84,888 |
| 2023 | 85,307 |
| 2024 | 86,004 |
The city added 568 residents over four years, a 0.7% growth rate. It actually lost about 1,000 people in 2021 before slowly recovering. By 2024, Baytown had finally surpassed its 2020 population.
Compare that to other Texas cities:
| City | 2024 Population | 4-Year Growth |
|---|---|---|
| Fort Worth | 1,008,106 | 9.1% |
| San Antonio | 1,526,656 | 6.1% |
| Lubbock | 272,086 | 5.4% |
| Houston | 2,390,125 | 4.0% |
| Austin | 993,588 | 2.9% |
| Baytown | 86,004 | 0.7% |
Baytown’s growth trails every major Texas city on this list. Slow population growth means less demand pressure on housing — one reason prices haven’t budged. For buyers, that’s a positive. You’re not competing against a surge of newcomers.
Baytown Housing Market Trends
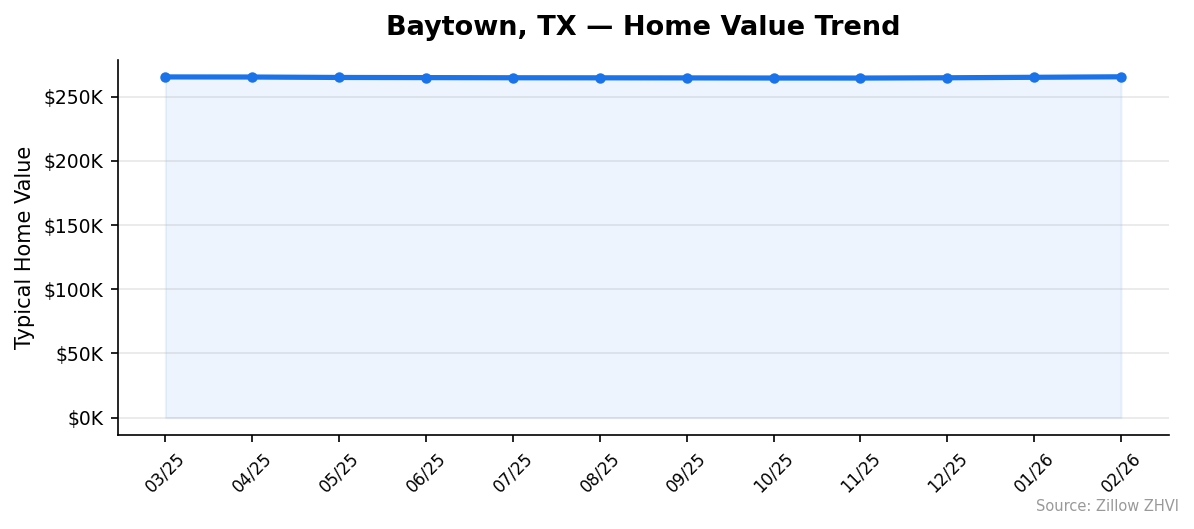
Here’s how prices moved over the past 12 months:
| Month | Avg. Home Value | Min ZIP | Max ZIP |
|---|---|---|---|
| Feb 2026 | $265,371 | $170,943 | $371,861 |
| Jan 2026 | $264,975 | $170,472 | $371,399 |
| Dec 2025 | $264,602 | $170,305 | $370,799 |
| Nov 2025 | $264,387 | $170,969 | $370,040 |
| Oct 2025 | $264,409 | $172,277 | $369,034 |
| Sep 2025 | $264,504 | $173,493 | $368,085 |
| Aug 2025 | $264,567 | $174,179 | $367,349 |
| Jul 2025 | $264,614 | $174,494 | $366,838 |
| Jun 2025 | $264,736 | $174,885 | $366,525 |
| May 2025 | $264,849 | $175,304 | $366,276 |
| Apr 2025 | $265,194 | $176,033 | $366,406 |
| Mar 2025 | $265,266 | $176,686 | $365,924 |
The citywide average barely moved — less than $1,000 of total variation across 12 months. But something interesting happened underneath.
The cheapest ZIP (77520) actually got cheaper. It dropped from $176,686 in March 2025 to $170,943 in February 2026, a 3.2% decline. Meanwhile, the most expensive ZIP (77523) climbed from $365,924 to $371,861, gaining 1.6%.
Baytown’s price gap is widening. The affordable end is getting more affordable. The expensive end is getting pricier.
Is Baytown a Good Place to Buy in 2026?
The numbers point to a balanced market. Zero price appreciation means sellers don’t have the upper hand. Buyers can negotiate without the pressure of rising prices.
At $265K, Baytown remains one of the more affordable options in the Houston metro. You’re getting Houston-area access at a discount. The three ZIP codes give you a clear range — from starter-home territory at $171K to established neighborhoods at $372K.
The risk? Flat prices mean your home won’t appreciate quickly. If you’re buying as an investment, Baytown won’t deliver fast returns. If you’re buying to live in for years and want stable, affordable housing near Houston, the math works.
Rents are reasonable across the board, which limits the buy-vs-rent urgency. Nobody is getting priced out of the rental market here.
Baytown Housing Market Outlook for 2026-2027
The 12-month trend shows a market that bottomed out around November 2025 and has been inching upward since. The citywide average rose from $264,387 in November to $265,371 in February — small, but consistent.
If the current pace continues, expect prices to stay in the $264K–$267K range through mid-2026. There’s no momentum for a breakout in either direction.
The divergence between ZIPs is worth watching. The cheapest area (77520) is still declining while the most expensive (77523) keeps climbing. That split could mean different buying windows depending on your target neighborhood.
Don’t expect dramatic shifts. Baytown’s slow population growth and balanced supply suggest more of the same: stable prices with minimal movement.
Similar Markets in TX
If you’re shopping in the Baytown area, these Texas cities offer different price points:
- Houston — The big neighbor, with far more inventory and ZIP code variety than Baytown
- Katy — West of Houston, popular with families looking for newer suburban construction
- Sugar Land — Another Houston-metro suburb, typically priced above Baytown
- San Antonio — Texas’s other affordable major city, with a larger market to browse
- Brownsville — If Baytown’s $265K median is still too high, Brownsville runs cheaper
Frequently Asked Questions
What is the average home price in Baytown?
The average home price in Baytown is $265,371 as of February 2026. Prices range from $170,943 in ZIP 77520 to $371,861 in ZIP 77523, giving buyers a $200K spread across just three neighborhoods.
Are home prices going up or down in Baytown?
Prices are flat — 0.0% year-over-year change. Month to month, values have edged up slightly since a low point in November 2025, but the movements are measured in hundreds of dollars, not thousands.
Is it cheaper to rent or buy in Baytown?
It depends on the ZIP code. In 77520, a mortgage on a $171K home runs about $1,130/month before taxes and insurance, compared to $1,268/month rent — buying has the edge. In pricier 77523, renting at $2,237 beats the estimated $2,450+ mortgage payment.
What is the most affordable neighborhood in Baytown?
ZIP code 77520 is the cheapest area in Baytown with a median home value of $170,943 and average rent of $1,268/month. It’s 36% below the citywide median, making it the clear entry point for budget-conscious buyers.
Methodology
Home values are based on the Zillow Home Value Index (ZHVI), a smoothed measure of typical home values in the 35th to 65th percentile range. Rent estimates use the Zillow Observed Rent Index (ZORI). Population figures come from the U.S. Census Bureau Population Estimates Program (2020-2024 vintage). All datasets are publicly available. Housing data updated 2026-02-28.