Bowling Green Home Prices: $301K, Up 0.9% — 4 ZIPs Analyzed (2026)
$301K. That’s what a typical home costs in Bowling Green right now — and prices are still climbing, even if barely.
The median home value in Bowling Green hit $300,775 in February 2026, up 0.9% from a year earlier. Not a surge. Not a crash. A slow grind upward in a city that’s been adding residents faster than almost anywhere else in Kentucky.
Quick answer: The average home price in Bowling Green, KY is $300,775 as of February 2026, up 0.9% year over year according to Zillow.
Current Home Prices in Bowling Green
Here’s where things stand as of February 2026:
| Metric | Value |
|---|---|
| Median Home Value | $300,775 |
| Year-over-Year Change | +0.9% |
| Lowest ZIP Median | $238,989 |
| Highest ZIP Median | $355,704 |
| Number of ZIPs Tracked | 4 |
The 0.9% gain is modest. It means a home worth $298,093 in March 2025 added roughly $2,700 in value over 12 months. If you bought at the peak of seasonal pricing last spring, you’re essentially flat.
The spread between the cheapest and most expensive neighborhoods is about $117,000. That’s a meaningful gap for a mid-sized city. You can still get under $240K in one ZIP code, or you can pay north of $355K in another just a few miles away.
Bowling Green sits well below the national median, which makes it attractive to relocators from pricier markets. But 0.9% appreciation won’t build equity fast. Buyers here are paying for affordability, not rapid gains.
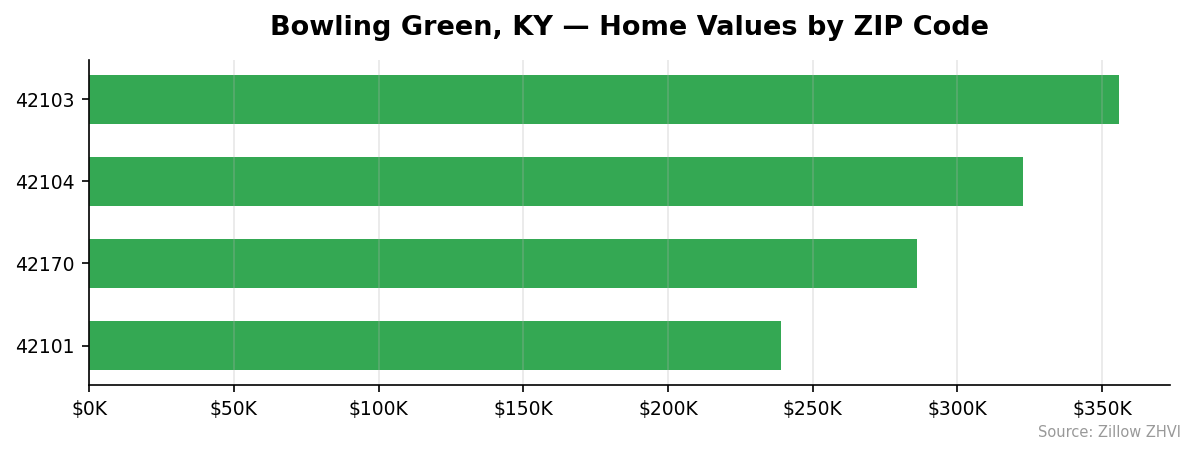
Bowling Green Home Prices by Neighborhood
All four tracked ZIP codes in Bowling Green show prices ranging from well under $240K to over $355K.
| ZIP Code | Median Home Value | Median Rent |
|---|---|---|
| 42101 | $238,989 | $1,227/mo |
| 42170 | $285,898 | Data not available |
| 42104 | $322,508 | $1,241/mo |
| 42103 | $355,704 | $1,288/mo |
Most Expensive
42103 tops the list at $355,704 — about 18% above the city median — and also carries the highest rent at $1,288 per month. 42104 comes in at $322,508, roughly 7% above average, with rent at $1,241.
Most Affordable
42101 is the clear bargain at $238,989, a full 21% below the city average, with the lowest tracked rent at $1,227 per month. 42170 sits at $285,898, about 5% below the median, though rent data isn’t yet available for that ZIP.
The price gap between the cheapest and most expensive ZIP is $116,715. That’s enough to change your monthly payment by roughly $600. If you’re on a budget, 42101 deserves a close look.
Rent vs Buy in Bowling Green
Average rent across the three tracked ZIP codes runs about $1,252 per month.
Now compare that to buying. On a $300,775 home with 20% down, you’d borrow about $240,620. At a 7% mortgage rate over 30 years, that’s roughly $1,601 per month in principal and interest alone. Add property taxes and insurance, and you’re looking at $1,850 to $1,950.
| Scenario | Monthly Cost |
|---|---|
| Average Rent | ~$1,252 |
| Mortgage (P&I only, 20% down, 7%) | ~$1,601 |
| Mortgage + Taxes & Insurance (est.) | ~$1,900 |
Renting saves you $600 to $650 per month on a cash-flow basis. That gap is real money — about $7,500 a year.
But the math isn’t that simple. With 0.9% annual appreciation, you’d gain roughly $2,700 in home equity per year from price increases alone, plus whatever you pay down on the principal. Renting gives you flexibility and lower monthly costs. Buying gives you a forced savings mechanism, but you need to stay put long enough for it to pay off.
At these rates, you’d probably need to hold a home for five-plus years before buying makes more financial sense than renting.
Population Growth and Migration
Bowling Green is one of the fastest-growing cities in Kentucky. The population jumped from 72,472 in 2020 to 79,076 in 2024 — a 9.1% increase in just four years.
| Year | Population |
|---|---|
| 2020 | 72,472 |
| 2021 | 73,151 |
| 2022 | 75,233 |
| 2023 | 77,069 |
| 2024 | 79,076 |
That growth dwarfs every other major city in the state:
| City | 2024 Population | 4-Year Growth |
|---|---|---|
| Bowling Green | 79,076 | +9.1% |
| Lexington | 329,437 | +2.1% |
| Louisville | 640,796 | +1.4% |
| Owensboro | 60,675 | +0.6% |
Bowling Green is adding people more than four times faster than Lexington and six times faster than Louisville. That kind of population pressure supports housing demand. More people means more competition for a limited number of homes, which puts a floor under prices even when the broader market softens.
The city added roughly 6,600 residents over four years. If that pace holds, expect continued pressure on both home prices and rents.
Bowling Green Housing Market Trends
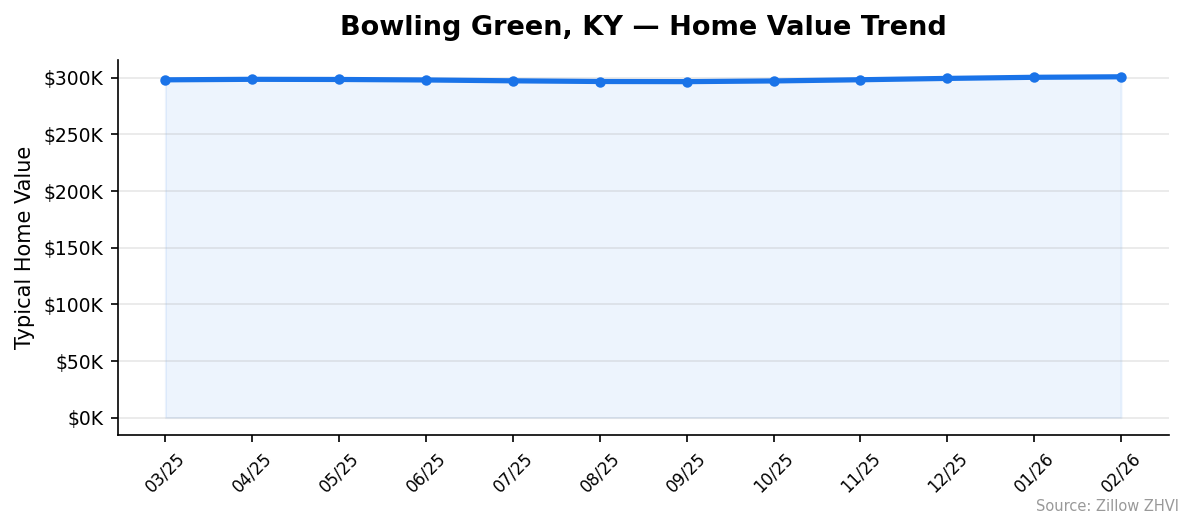
Here’s how the median home value moved month by month over the past year:
| Month | Median Value | Change from Prior Month |
|---|---|---|
| Mar 2025 | $298,093 | — |
| Apr 2025 | $298,546 | +$453 |
| May 2025 | $298,406 | -$140 |
| Jun 2025 | $297,970 | -$436 |
| Jul 2025 | $297,214 | -$756 |
| Aug 2025 | $296,615 | -$599 |
| Sep 2025 | $296,500 | -$115 |
| Oct 2025 | $297,108 | +$608 |
| Nov 2025 | $298,162 | +$1,054 |
| Dec 2025 | $299,341 | +$1,179 |
| Jan 2026 | $300,327 | +$986 |
| Feb 2026 | $300,775 | +$448 |
The pattern is clear. Prices dipped slightly from May through September 2025, then reversed course. Since October, Bowling Green has posted five straight months of gains. The dip was shallow — only about $2,000 from peak to trough — and the recovery brought prices to a new 12-month high by January.
That mid-year softness is typical seasonal behavior. Summer slowdowns happen in most markets. What matters is the direction: prices are climbing again, and the October-to-February gains have been steady.
Is Bowling Green a Good Place to Buy in 2026?
The numbers point to a stable market, not a hot one.
Appreciation of 0.9% per year won’t make you rich. But it also means you’re unlikely to buy at a peak and watch your equity evaporate. Prices have been remarkably steady, moving in a narrow band between $296,500 and $300,775 over the past 12 months. That’s less than a 1.5% swing from bottom to top.
Population growth of 9.1% in four years is the strongest signal here. More people, same housing stock — that math favors owners. The rent-to-buy gap is wide, which suggests demand for rentals is high and could support investor purchases.
If you’re buying to live in, Bowling Green offers a relatively low entry point compared to national prices, stable appreciation, and a growing local economy. If you’re buying as an investment, the rental yields look reasonable, but appreciation alone won’t carry returns.
This is a buy-and-hold market, not a flip market.
Bowling Green Housing Market Outlook for 2026-2027
The five-month winning streak from October through February suggests continued upward momentum heading into spring 2026. If the current pace of roughly $700 to $1,000 per month in gains continues, Bowling Green could reach the $305,000 to $308,000 range by mid-summer.
The seasonal pattern from 2025 hints at a possible plateau or minor pullback in the summer months. Prices dipped about $2,000 between May and September last year. A similar pattern could repeat.
The 9.1% population growth rate is the strongest tailwind. As long as Bowling Green keeps attracting new residents, downside risk is limited. The three-month trend shows prices accelerating into 2026, which makes a major correction unlikely in the near term.
Similar Markets in KY
If you’re considering Bowling Green, these other Kentucky markets are worth comparing:
- Louisville — Kentucky’s largest city offers a much bigger housing stock and more neighborhood variety than Bowling Green.
- Lexington — The state’s second-largest city, with a university-driven economy similar to Bowling Green’s WKU influence.
- Pineville — A small-town option in southeastern Kentucky for buyers seeking significantly lower prices.
- Whitesburg — Deep in Appalachian Kentucky, offering an entirely different price point and lifestyle.
Frequently Asked Questions
What is the average home price in Bowling Green?
The average home price in Bowling Green is $300,775 as of February 2026. That figure represents the median across all four tracked ZIP codes, where prices range from $238,989 in 42101 to $355,704 in 42103.
Are home prices going up or down in Bowling Green?
Prices are up 0.9% year over year. After a small mid-2025 dip, values have risen for five consecutive months. The market is trending upward, but slowly.
Is it cheaper to rent or buy in Bowling Green?
Renting is cheaper on a monthly basis. Average rent across tracked ZIPs is about $1,252 per month. A mortgage on the median home runs roughly $1,600 to $1,900 depending on your tax and insurance costs. You’d save about $600 per month by renting.
What is the most affordable neighborhood in Bowling Green?
ZIP code 42101 is the most affordable, with a median home value of $238,989 — about $62,000 below the city average. Rent there runs $1,227 per month, also the lowest among tracked areas.
Methodology
Home values are based on the Zillow Home Value Index (ZHVI), a smoothed measure of typical home values in the 35th to 65th percentile range. Rent estimates use the Zillow Observed Rent Index (ZORI). Population figures come from the U.S. Census Bureau Population Estimates Program (2020-2024 vintage). All datasets are publicly available. Housing data updated 2026-02-28.