Ann Arbor Home Prices: $511K, Up 2.8% — 4 ZIPs Analyzed (2026)
Can you still afford a house in Ann Arbor? The median home now sits at $510,547 — up 2.8% from a year ago. That puts the typical Ann Arbor home well above the national average, and the gap keeps widening.
Quick answer: The average home price in Ann Arbor, MI is $510,547 as of February 2026, up 2.8% year over year according to Zillow.
Current Home Prices in Ann Arbor
Here’s where the Ann Arbor market stands right now:
| Metric | Value |
|---|---|
| Median Home Price | $510,547 |
| Year-over-Year Change | +2.8% |
| Lowest Price (ZIP 48108) | $432,719 |
| Highest Price (ZIP 48104) | $559,098 |
| Number of ZIPs Tracked | 4 |
| Data As Of | February 2026 |
A $511K median means a 20% down payment of roughly $102,000. At current mortgage rates near 7%, the remaining $409K loan translates to about $2,720 per month in principal and interest alone. Add property taxes and insurance, and you’re looking at $3,200 or more.
The 2.8% annual increase sounds modest, but it adds roughly $14,000 to the price of a typical home in just one year. That’s real money — especially for first-time buyers trying to save for a down payment while prices climb.
Ann Arbor’s price floor sits at $432,719 in ZIP 48108. The ceiling is $559,098 in 48104. That $126,000 spread means your neighborhood choice matters a lot.
Ann Arbor Home Prices by Neighborhood
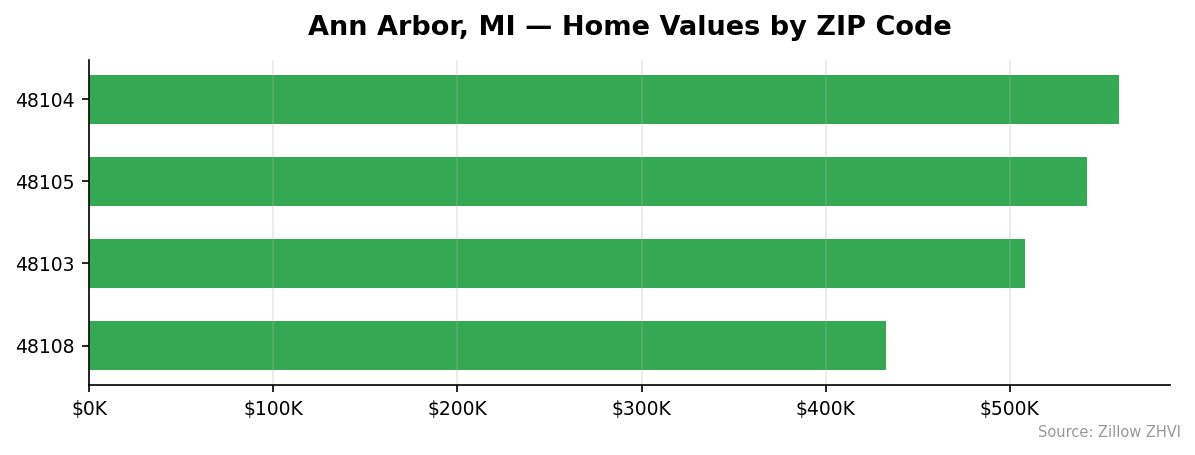
All four tracked ZIP codes in Ann Arbor show six-figure home values, but the differences between them are significant.
| ZIP Code | Median Home Value | Avg Monthly Rent |
|---|---|---|
| 48104 | $559,098 | $2,852 |
| 48105 | $541,869 | $2,553 |
| 48103 | $508,503 | $2,297 |
| 48108 | $432,719 | $2,059 |
Most Expensive
48104 leads Ann Arbor at $559,098 — nearly $49,000 above the city median — with rents to match at $2,852 per month. 48105 follows at $541,869, carrying the second-highest rents in the city at $2,553. 48103 sits almost exactly at the city median with a $508,503 price tag and $2,297 rent.
Most Affordable
48108 is the clear budget pick at $432,719, roughly 15% below the city average. Rents here are the lowest too at $2,059 per month. It’s the only Ann Arbor ZIP where you can find a typical home under $450K.
Rent vs Buy in Ann Arbor
Renting is the cheaper monthly option in Ann Arbor right now — but the math is closer than you might think.
| ZIP Code | Monthly Rent | Est. Mortgage (P&I) | Difference |
|---|---|---|---|
| 48103 | $2,297 | ~$2,707 | Rent saves ~$410/mo |
| 48104 | $2,852 | ~$2,976 | Rent saves ~$124/mo |
| 48105 | $2,553 | ~$2,884 | Rent saves ~$331/mo |
| 48108 | $2,059 | ~$2,303 | Rent saves ~$244/mo |
Mortgage estimates assume 20% down, 7% rate, 30-year fixed, principal and interest only.
In 48104, the gap between renting and buying is just $124 a month. That’s slim. Factor in equity building, and buying starts to look competitive — if you plan to stay more than a few years.
The widest gap is in 48103, where renting saves about $410 a month. But these numbers don’t include property taxes, insurance, or maintenance, which push the real cost of ownership higher. For most buyers, renting is the cheaper near-term play. The question is how long you plan to stay.
Population Growth and Migration
Ann Arbor’s population has been essentially flat — and slightly negative. The city dropped from 123,757 residents in 2020 to 122,925 in 2024, a decline of 0.7%.
| Year | Population |
|---|---|
| 2020 | 123,757 |
| 2021 | 119,603 |
| 2022 | 121,274 |
| 2023 | 122,645 |
| 2024 | 122,925 |
The 2021 dip to 119,603 was sharp — likely pandemic-related — but the city has been recovering since. It’s still 832 residents short of its 2020 count.
Compare that to other Michigan cities:
| City | 2024 Population | 4-Year Growth |
|---|---|---|
| Detroit | 645,705 | +1.1% |
| Grand Rapids | 200,117 | +0.7% |
| Lansing | 114,336 | +1.6% |
| Troy | 89,209 | +2.4% |
| Farmington Hills | 84,173 | +0.4% |
| Ann Arbor | 122,925 | -0.7% |
Ann Arbor is the only city in this group losing residents. Troy is growing fastest at 2.4%. Even Detroit posted gains.
For the housing market, flat population with rising prices suggests demand is driven by something other than pure population growth — likely the University of Michigan’s economic anchor and limited housing supply.
Ann Arbor Housing Market Trends
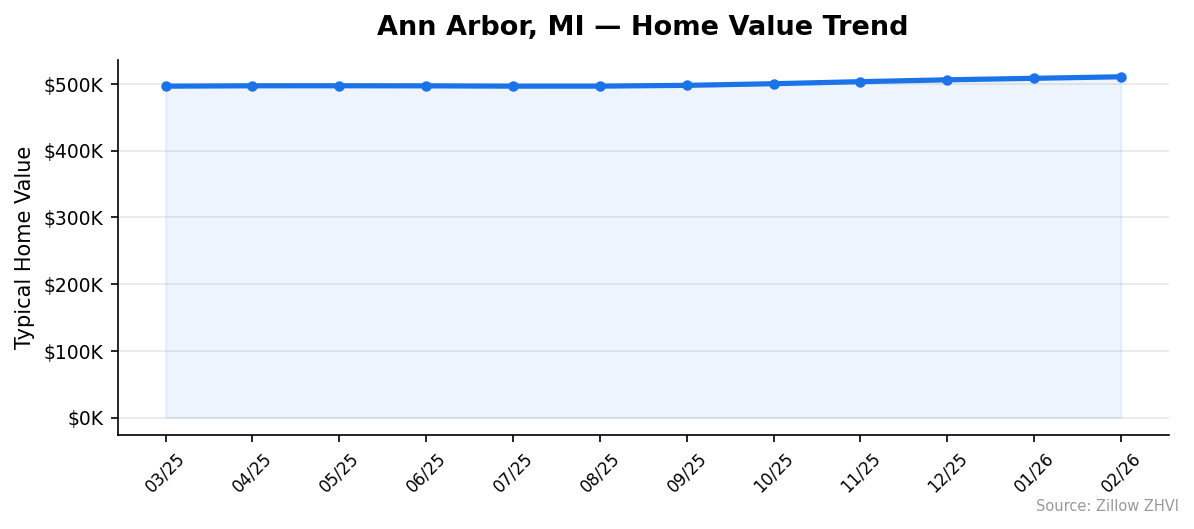
The 12-month trend tells a clear story: steady, uninterrupted growth since mid-2025.
| Month | Avg Price | Low (ZIP) | High (ZIP) |
|---|---|---|---|
| Feb 2026 | $510,547 | $432,719 | $559,098 |
| Jan 2026 | $508,276 | $431,253 | $556,285 |
| Dec 2025 | $506,013 | $429,957 | $553,229 |
| Nov 2025 | $503,234 | $428,528 | $549,745 |
| Oct 2025 | $500,169 | $426,922 | $545,510 |
| Sep 2025 | $497,728 | $425,308 | $542,312 |
| Aug 2025 | $496,568 | $424,332 | $540,282 |
| Jul 2025 | $496,533 | $423,854 | $539,599 |
| Jun 2025 | $496,979 | $423,988 | $539,628 |
| May 2025 | $497,099 | $424,045 | $538,837 |
| Apr 2025 | $497,057 | $424,302 | $537,771 |
| Mar 2025 | $496,495 | $424,059 | $536,147 |
Prices bottomed around $496K in March–July 2025, then climbed every single month from August through February 2026. The total gain over 12 months: about $14,000.
Notice the acceleration. From March to August 2025, prices barely moved — less than $100 total. Then from August to February, they jumped over $14,000. The second half of the year did all the heavy lifting.
Is Ann Arbor a Good Place to Buy in 2026?
The numbers point to a seller’s market. Prices are rising, inventory pressure persists, and there’s no sign of a pullback in the data.
Buyers face $511K median prices, which require substantial income. A rough rule of thumb: you need household income near $130,000–$150,000 to comfortably afford the median home here. That’s well above the national household median.
On the plus side, the 2.8% annual appreciation isn’t runaway growth. It’s steady. You’re not buying into a bubble — you’re buying into a market that grinds higher slowly. If you’re planning to hold for five or more years, the trend favors ownership.
The rent-versus-buy gap is narrow enough that buying makes financial sense for long-term residents, especially in ZIP 48104 where the monthly difference is under $125.
For investors, yields are tight. A $559K property renting at $2,852 per month isn’t a cash flow play.
Ann Arbor Housing Market Outlook for 2026-2027
The 12-month trend shows clear upward momentum that has been accelerating since late summer 2025. Monthly gains have averaged roughly $2,300 since September.
If the current pace continues, Ann Arbor’s median could approach $520K–$525K by mid-2026. There’s no data suggesting a reversal — each of the last seven months posted gains.
The flat population is worth watching. If Ann Arbor continues to lose or stagnate in residents while prices climb, affordability pressure could eventually slow appreciation. But with the University of Michigan anchoring demand, that constraint has been in play for years without slowing growth.
The 3-month trend from December through February shows consistent $2,200–$2,300 monthly increases. That pace is sustainable but not explosive.
Similar Markets in MI
If you’re considering Ann Arbor, these Michigan markets are worth comparing:
- Detroit — Far more affordable than Ann Arbor with a much larger inventory and growing population.
- Grand Rapids — West Michigan’s largest city, growing at 0.7% with a different price profile.
- Lansing — The state capital, 60 miles west, growing faster than Ann Arbor at 1.6%.
- Kalamazoo — Another college town with a smaller footprint.
- Sterling Heights — Suburban Detroit option for buyers priced out of Ann Arbor.
Frequently Asked Questions
What is the average home price in Ann Arbor?
The average home price in Ann Arbor is $510,547 as of February 2026. Across the city’s four tracked ZIP codes, values range from $432,719 in ZIP 48108 to $559,098 in ZIP 48104.
Are home prices going up or down in Ann Arbor?
Prices are going up. Ann Arbor home values increased 2.8% year over year. The market has posted gains every month since August 2025, with no months of decline in the trailing 12-month window.
Is it cheaper to rent or buy in Ann Arbor?
Renting is cheaper on a monthly basis across all four ZIP codes. The gap ranges from $124 per month in 48104 to $410 per month in 48103. These estimates compare average rent to a 20% down, 7% rate mortgage — actual buying costs including taxes and insurance widen the gap further.
What is the most affordable neighborhood in Ann Arbor?
ZIP code 48108 is the most affordable area with a typical home value of $432,719 — about 15% below the city median. Rent there averages $2,059 per month, also the lowest in Ann Arbor.
Methodology
Home values are based on the Zillow Home Value Index (ZHVI), a smoothed measure of typical home values in the 35th to 65th percentile range. Rent estimates use the Zillow Observed Rent Index (ZORI). Population figures come from the U.S. Census Bureau Population Estimates Program (2020-2024 vintage). All datasets are publicly available. Housing data updated 2026-02-28.