Garland Home Prices: $283K, Down 5.1% — 5 ZIPs Analyzed (2026)
$282,524. That’s what a typical home in Garland costs right now — and it’s falling. Prices dropped 5.1% year over year, one of the steeper declines in the Dallas-Fort Worth metro. For buyers who waited out the pandemic surge, the math is finally shifting.
Quick answer: The average home price in Garland, TX is $282,524 as of February 2026, down 5.1% year over year according to Zillow.
Current Home Prices in Garland
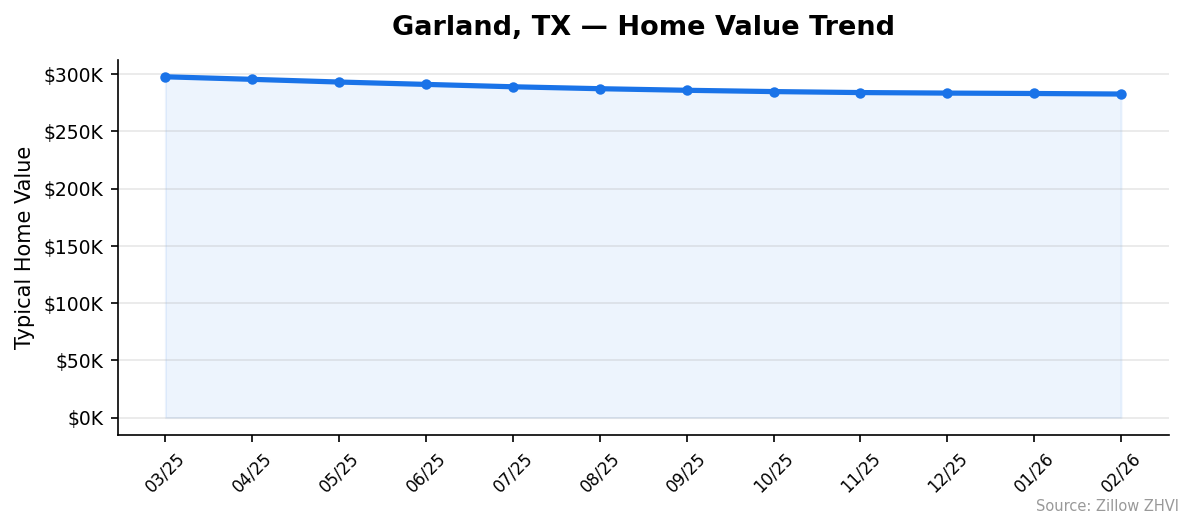
Garland’s housing market has cooled significantly. The median home value sits at $282,524 — well below its recent peak of $352,397, recorded in March 2025. That’s a drop of nearly $70,000 in under a year.
| Metric | Value |
|---|---|
| Median Home Value | $282,524 |
| Year-over-Year Change | -5.1% |
| Lowest ZIP Median | $243,094 |
| Highest ZIP Median | $335,875 |
| Number of ZIPs Tracked | 5 |
| Data as of | February 2026 |
The price range across Garland’s five ZIP codes spans about $93,000. That gap matters. A buyer with $280K can afford the city average, but the most expensive ZIP pushes well past $335K. Meanwhile, the cheapest ZIP sits under $245K — a 28% discount compared to the top.
Every ZIP code in Garland has lost value over the past year. This isn’t a neighborhood-specific dip. It’s a city-wide correction.
Garland Home Prices by Neighborhood
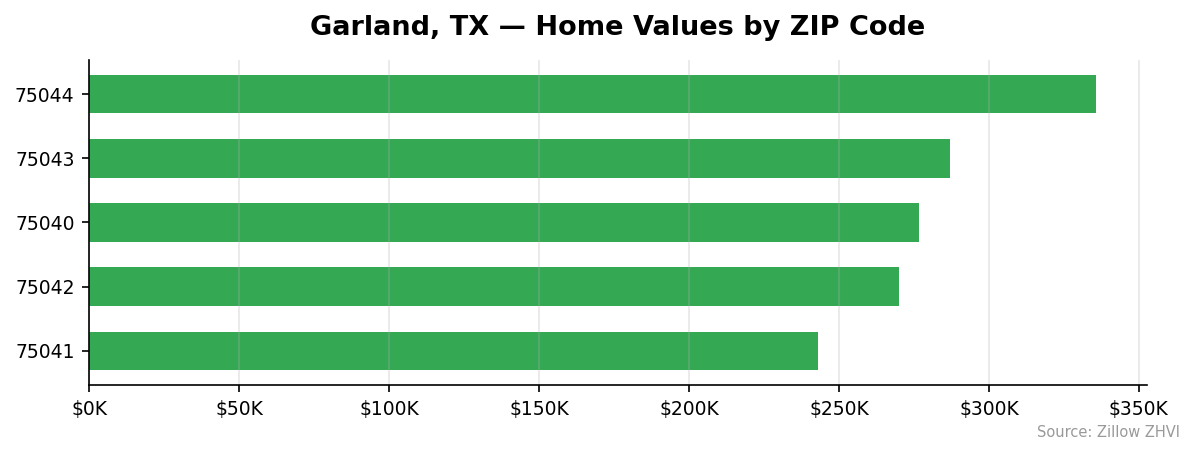
Garland covers five ZIP codes, each with a distinct price point. Here’s how they compare:
| ZIP Code | Median Home Value | Median Rent |
|---|---|---|
| 75044 | $335,875 | $1,540/mo |
| 75043 | $286,898 | $1,379/mo |
| 75040 | $276,768 | $1,827/mo |
| 75042 | $269,986 | $1,422/mo |
| 75041 | $243,094 | $1,744/mo |
Most Expensive
75044 leads at $335,875 — about 19% above the city median. Despite the highest home prices, rent here is moderate at $1,540/month, suggesting stronger owner-occupancy rates.
Most Affordable
75041 comes in at $243,094, a full $39,000 below the city average. Interestingly, rents in 75041 run $1,744/month — the second-highest in the city. That gap between low home prices and high rents makes this ZIP stand out for investors.
75042 at $269,986 is the second most affordable option. Rents are lower here at $1,422/month, closer to what you’d expect for the price range.
Rent vs Buy in Garland
The rent-or-buy decision in Garland isn’t straightforward. Here’s why.
The average rent across Garland’s five ZIP codes is roughly $1,582/month. A mortgage on the median home of $282,524 — assuming 20% down and a 7% interest rate — runs about $1,504/month in principal and interest. Add property taxes and insurance, and the monthly cost of owning pushes closer to $2,100-$2,300.
| ZIP Code | Median Rent | Est. Mortgage (P&I, 20% down) |
|---|---|---|
| 75044 | $1,540 | $1,787 |
| 75043 | $1,379 | $1,528 |
| 75040 | $1,827 | $1,474 |
| 75042 | $1,422 | $1,438 |
| 75041 | $1,744 | $1,295 |
Two ZIPs flip the usual script. In 75040, renting costs $1,827/month while a mortgage payment would be $1,474. In 75041, the gap is even wider — $1,744 rent versus $1,295 mortgage. If you can manage the down payment, buying in those areas saves you money from month one.
In 75044 and 75043, renting is cheaper than a mortgage payment. Buyers there are paying a premium for equity.
Population Growth and Migration
Garland has 250,431 residents as of 2024. The city grew 1.6% since 2020 — steady but slow.
| Year | Population |
|---|---|
| 2020 | 246,392 |
| 2021 | 244,391 |
| 2022 | 246,918 |
| 2023 | 246,283 |
| 2024 | 250,431 |
The growth wasn’t linear. Garland actually lost about 2,000 residents in 2021 before recovering. The 2024 jump of roughly 4,100 people is the largest single-year gain in this window.
Compared to other Texas cities, Garland’s growth is modest:
| City | 2024 Population | 4-Year Growth |
|---|---|---|
| Fort Worth | 1,008,106 | 9.1% |
| San Antonio | 1,526,656 | 6.1% |
| Lubbock | 272,086 | 5.4% |
| Houston | 2,390,125 | 4.0% |
| Austin | 993,588 | 2.9% |
| Garland | 250,431 | 1.6% |
Fort Worth grew nearly six times faster. Even Lubbock — a city of similar size — added residents at more than triple Garland’s rate. Slower population growth means less demand pressure on housing, which partly explains why prices here are softening while some Texas metros hold firm.
Garland Housing Market Trends
Prices have fallen every single month for the past year. Here’s the full 12-month picture:
| Month | Median Value | Monthly Change |
|---|---|---|
| Feb 2026 | $282,524 | -$461 |
| Jan 2026 | $282,985 | -$354 |
| Dec 2025 | $283,339 | -$463 |
| Nov 2025 | $283,802 | -$857 |
| Oct 2025 | $284,659 | -$1,131 |
| Sep 2025 | $285,790 | -$1,382 |
| Aug 2025 | $287,172 | -$1,685 |
| Jul 2025 | $288,857 | -$2,072 |
| Jun 2025 | $290,929 | -$2,063 |
| May 2025 | $292,992 | -$2,352 |
| Apr 2025 | $295,344 | -$2,232 |
| Mar 2025 | $297,576 | — |
The decline accelerated through spring and summer 2025, with monthly drops exceeding $2,000. Since October, the pace has slowed. February’s $461 drop is the smallest in the series.
Total decline from March 2025 to February 2026: $15,052, or about 5.1%. A buyer who waited a year saved roughly $15K on the same house.
Is Garland a Good Place to Buy in 2026?
The numbers favor buyers right now. Prices are down 5.1% and still sliding. The monthly decline is decelerating — from $2,300/month losses in spring 2025 to under $500 in early 2026 — but the direction hasn’t reversed.
Garland’s median of $282,524 makes it one of the more affordable options in the Dallas-Fort Worth metro. You’re inside a major metro area with a population over 250,000, and you can still find ZIP codes under $250K.
The risk: if you buy now and prices keep falling, you start underwater. The reward: mortgage payments in two of five ZIP codes already beat local rents. If you plan to stay five or more years, the current dip could look like a buying opportunity in hindsight.
For investors, the rent-to-price ratio in 75041 and 75040 is worth a close look. High rents relative to home values mean better cash flow potential.
Garland Housing Market Outlook for 2026-2027
The 12-month trend shows a clear slowdown in price declines. Monthly drops shrank from over $2,000 in mid-2025 to under $500 by early 2026. If that deceleration continues at the same pace, prices could flatten by mid-2026.
But flattening isn’t the same as recovery. The 3-month trend from December 2025 through February 2026 shows steady losses of $350-$460 per month. At that rate, Garland could shed another $2,000-$3,000 before stabilizing.
A reversal would likely require either a drop in mortgage rates or a pickup in population growth — neither of which is visible in the current data. Expect Garland’s market to remain soft through the rest of 2026, with prices drifting lower before finding a floor.
Similar Markets in TX
If you’re considering Garland, these nearby Texas markets are worth comparing:
- Grand Prairie — Right next door in the DFW metro with a similar suburban profile.
- Dallas — The urban core of the metro, typically priced higher but with more inventory.
- Houston — Texas’s largest city offers a different job market mix and a wider range of price points.
- San Antonio — A more affordable major metro that’s been growing at 6.1%.
- El Paso — One of Texas’s lowest-cost cities for buyers on a tighter budget.
Frequently Asked Questions
What is the average home price in Garland?
The average home price in Garland is $282,524 as of February 2026. Prices range from $243,094 in ZIP code 75041 to $335,875 in 75044. The city-wide median has dropped 5.1% compared to a year ago.
Are home prices going up or down in Garland?
Down. Garland home prices have fallen every month for the past 12 months, losing a total of about $15,000 since March 2025. The year-over-year decline is 5.1%. The pace of decline has slowed in recent months, but prices have not yet turned a corner.
Is it cheaper to rent or buy in Garland?
It depends on your ZIP code. In 75041 and 75040, monthly mortgage payments (with 20% down at 7%) are significantly cheaper than local rents. In 75044 and 75043, renting costs less. City-wide, the average rent is about $1,582/month, while a mortgage on the median home runs about $1,504/month before taxes and insurance.
What is the most affordable neighborhood in Garland?
ZIP code 75041 has the lowest median home value at $243,094 — about $39,000 below the city average. It also has relatively high rents at $1,744/month, making it an interesting option for both buyers and investors.
Methodology
Home values are based on the Zillow Home Value Index (ZHVI), a smoothed measure of typical home values in the 35th to 65th percentile range. Rent estimates use the Zillow Observed Rent Index (ZORI). Population figures come from the U.S. Census Bureau Population Estimates Program (2020-2024 vintage). All datasets are publicly available. Housing data updated 2026-02-28.