Huntington Beach Home Prices: $1,517K, Up 2% — 5 ZIPs Analyzed (2026)
$1,517,054. That’s what a typical home costs in Huntington Beach right now. Prices climbed 2.0% over the past year, and the cheapest ZIP in the city still runs over $1.2 million. If you’re shopping here, you need to know which neighborhoods carry the steepest premiums and where you might save a few hundred thousand.
Quick answer: The average home price in Huntington Beach, CA is $1,517,054 as of February 2026, up 2.0% year over year according to Zillow.
Current Home Prices in Huntington Beach
| Metric | Value |
|---|---|
| Median Home Price | $1,517,054 |
| Year-over-Year Change | +2.0% |
| Lowest ZIP Price | $1,224,710 |
| Highest ZIP Price | $2,134,309 |
| Number of ZIPs Tracked | 5 |
| Data as of | February 2026 |
A 2% annual gain sounds modest, but on a $1.5 million base that translates to roughly $30,000 in added value over twelve months. The gap between the cheapest and most expensive ZIP is $909,599 — nearly a million dollars separating opposite ends of the same city.
Huntington Beach sits within the Los Angeles-Long Beach-Anaheim metro, one of the priciest housing markets in the country. Even the floor price here would buy a top-tier home in most U.S. cities.
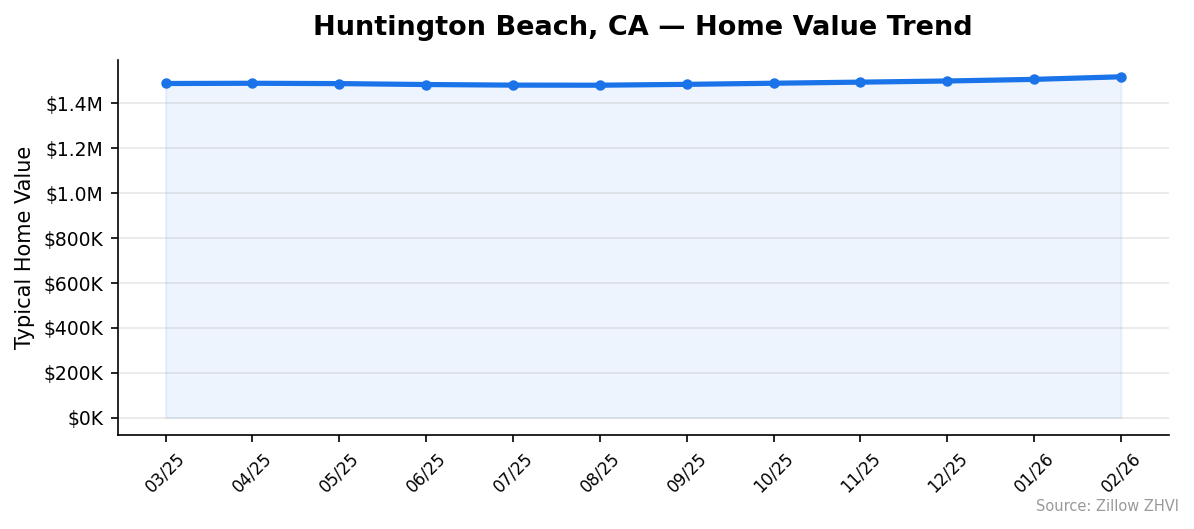
Monthly movement has been consistently upward. Since bottoming out around $1,479,565 in August 2025, the city-wide average has gained about $37,500 through February 2026. That’s not a spike — it’s a slow, persistent climb.
Huntington Beach Home Prices by Neighborhood
| ZIP Code | Median Home Price | Median Rent |
|---|---|---|
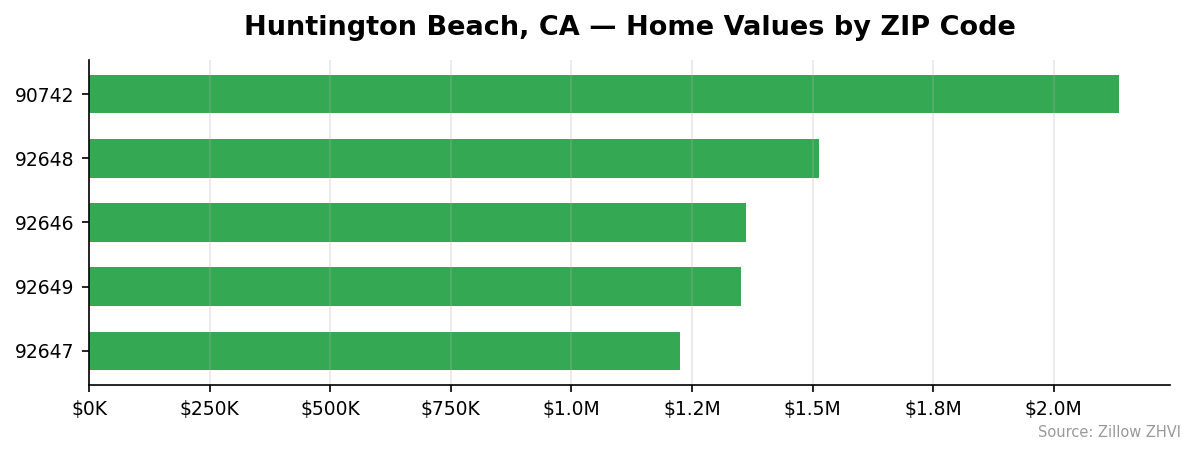
| 90742 | $2,134,309 | Data not available |
| 92648 | $1,512,493 | $3,499/mo |
| 92646 | $1,361,939 | $3,153/mo |
| 92649 | $1,351,817 | $2,904/mo |
| 92647 | $1,224,710 | $2,825/mo |
Most Expensive
90742 leads at $2,134,309 — 41% above the city average. This ZIP, covering the Sunset Beach area, carries a premium that puts it in a different category from the rest of Huntington Beach. No rent data is tracked here, suggesting the area is predominantly owner-occupied.
92648 comes in at $1,512,493, essentially matching the city-wide median. Rents here are the highest tracked at $3,499/month, reflecting the beachfront and downtown core location.
Most Affordable
92647 is the entry point at $1,224,710, about $292,000 below the city average. Rents are correspondingly lower at $2,825/month, making it the most accessible part of the city for both buyers and renters.
92649 at $1,351,817 offers a middle path. Rents of $2,904/month sit below the city norm, and the home price discount versus 92648 is roughly $161,000.
92646 rounds out the lower tier at $1,361,939 with rents of $3,153/month.
Rent vs Buy in Huntington Beach
Four of the five ZIP codes have rent data. Here’s how the numbers break down.
| ZIP Code | Median Home Price | Monthly Rent | Est. Monthly Mortgage* |
|---|---|---|---|
| 92647 | $1,224,710 | $2,825 | ~$6,520 |
| 92646 | $1,361,939 | $3,153 | ~$7,250 |
| 92648 | $1,512,493 | $3,499 | ~$8,050 |
| 92649 | $1,351,817 | $2,904 | ~$7,195 |
Estimated mortgage: 20% down, 6.8% rate, principal and interest only. Does not include property taxes, insurance, or HOA fees.
The math is stark. Renting costs less than half of buying in every ZIP code. Even in the cheapest area (92647), you’d pay $2,825 to rent versus an estimated $6,520 mortgage payment — and that’s before adding property taxes on a $1.2 million assessment, homeowner’s insurance, and potential HOA dues.
The total monthly ownership cost in Huntington Beach likely runs $9,000 to $12,000 depending on the neighborhood. Renting at $2,825 to $3,499 is a fraction of that.
This doesn’t mean buying is a bad decision. Owners who purchased a few years ago at lower prices are building equity. But for new buyers, the carrying costs are steep relative to renting.
Population Growth and Migration
Huntington Beach is losing residents. The city’s population dropped from 198,422 in 2020 to 193,151 in 2024 — a decline of 2.7% over four years.
| Year | Population |
|---|---|
| 2020 | 198,422 |
| 2021 | 196,404 |
| 2022 | 194,777 |
| 2023 | 193,334 |
| 2024 | 193,151 |
The losses have slowed. The city shed about 2,000 residents between 2020 and 2021, but only 183 between 2023 and 2024. The outflow may be stabilizing.
Compare that to other California cities:
| City | 2024 Population | 4-Year Growth |
|---|---|---|
| San Diego | 1,404,452 | +1.4% |
| Fresno | 550,105 | +1.4% |
| Sacramento | 535,798 | +1.9% |
| Oakland | 443,554 | +0.6% |
| Bakersfield | 417,468 | +3.0% |
Every city on this list grew while Huntington Beach shrank. Bakersfield added 3.0% in the same period. The pattern fits a common California story: expensive coastal cities lose population to more affordable inland areas.
Despite the population decline, home prices continue rising. Fewer residents hasn’t meant less demand — it likely reflects existing homeowners staying put while some renters and would-be buyers leave for cheaper markets.
Huntington Beach Housing Market Trends
| Month | Average Price | Low (ZIP) | High (ZIP) |
|---|---|---|---|
| Feb 2026 | $1,517,054 | $1,224,710 | $2,134,309 |
| Jan 2026 | $1,505,563 | $1,218,516 | $2,109,931 |
| Dec 2025 | $1,498,340 | $1,212,090 | $2,107,460 |
| Nov 2025 | $1,493,236 | $1,204,355 | $2,121,725 |
| Oct 2025 | $1,488,360 | $1,198,176 | $2,131,203 |
| Sep 2025 | $1,483,382 | $1,195,107 | $2,130,788 |
| Aug 2025 | $1,479,565 | $1,194,738 | $2,126,184 |
| Jul 2025 | $1,479,957 | $1,197,252 | $2,128,396 |
| Jun 2025 | $1,482,611 | $1,200,788 | $2,132,509 |
| May 2025 | $1,486,749 | $1,206,017 | $2,132,467 |
| Apr 2025 | $1,488,167 | $1,209,329 | $2,126,093 |
| Mar 2025 | $1,487,187 | $1,209,776 | $2,118,628 |
The 12-month trajectory breaks into two phases. From March to August 2025, prices drifted slightly lower — the city average dipped from $1,487,187 to $1,479,565, a loss of about $7,600. Then the trend reversed.
Since August 2025, prices have climbed every single month. The average rose from $1,479,565 to $1,517,054 — a gain of $37,489 in six months. That’s roughly $6,250 per month in appreciation.
The floor has been rising too. The cheapest ZIP went from $1,194,738 in August to $1,224,710 in February, a $29,972 increase. Even the most affordable entry point is pulling away from buyers on the margin.
Is Huntington Beach a Good Place to Buy in 2026?
The data points to a seller-friendly market. Prices are rising steadily, inventory pressure keeps values high, and the rent-to-own gap suggests strong demand for homeownership despite the cost.
For buyers with the budget, the 2% annual appreciation is modest enough that you’re not buying into a frenzy. This isn’t a market where prices are spiking 10% a year. The gains are incremental, which reduces the risk of a sharp correction.
The risk? You’re buying a $1.5 million asset in a city that’s losing population. If that outflow accelerates, demand could soften. For now, the population decline has had zero visible effect on prices — but it’s worth watching.
If you need to stay under $1.3 million, your only option is ZIP 92647. Every other area starts well above that mark. If you’re looking at 90742, you’re in a $2.1 million market that plays by different rules than the rest of the city.
Huntington Beach Housing Market Outlook for 2026-2027
The last six months show a clear upward trend with no sign of flattening. If the current pace of roughly $6,250 per month continues, the city-wide median could approach $1,555,000 by mid-2026.
The three-month trend from December 2025 through February 2026 shows accelerating gains: $5,096 in December-to-January, then $11,491 from January to February. That acceleration may reflect seasonal buying pressure as spring approaches, and could moderate in late summer as it did in 2025.
The floor prices are climbing faster than the ceiling. The gap between the cheapest and most expensive ZIP has narrowed slightly over the past year. That compression suggests broad-based demand rather than a luxury-driven spike.
Don’t expect a correction based on this data. Nothing in the 12-month trend suggests downward momentum.
Similar Markets in CA
If you’re exploring the Southern California market beyond Huntington Beach, these cities offer different price points:
- Anaheim — a neighboring city in the same metro with a lower price floor
- Long Beach — coastal living south of LA, another option in the LA-Long Beach-Anaheim metro
- San Diego — further south with a growing population of 1.4 million and rising prices
- Chula Vista — near the Mexican border, part of the San Diego metro with a different cost profile
- Oxnard — up the coast in Ventura County, often more affordable than Orange County beach cities
Frequently Asked Questions
What is the average home price in Huntington Beach?
The average home price in Huntington Beach is $1,517,054 as of February 2026. Prices across the city’s five tracked ZIP codes range from $1,224,710 in the 92647 area to $2,134,309 in the 90742 area.
Are home prices going up or down in Huntington Beach?
Prices are going up. The year-over-year increase is 2.0%, and the city average has risen every month since August 2025. Over the past six months, the median climbed by roughly $37,500.
Is it cheaper to rent or buy in Huntington Beach?
Renting is much cheaper. Monthly rents range from $2,825 to $3,499 across the city. A mortgage on the median-priced home — assuming 20% down and a 6.8% rate — would run approximately $8,050 per month in principal and interest alone, before taxes and insurance.
What is the most affordable neighborhood in Huntington Beach?
ZIP code 92647 is the most affordable at $1,224,710. It also has the lowest rents at $2,825/month. This area sits about $292,000 below the city-wide median, making it the closest thing to a bargain in Huntington Beach.
Methodology
Home values are based on the Zillow Home Value Index (ZHVI), a smoothed measure of typical home values in the 35th to 65th percentile range. Rent estimates use the Zillow Observed Rent Index (ZORI). Population figures come from the U.S. Census Bureau Population Estimates Program (2020-2024 vintage). All datasets are publicly available. Housing data updated 2026-02-28.