Jackson Home Prices: $179K, Up 2.3% — 3 ZIPs Analyzed (2026)
$178,956. That’s what a typical home costs in Jackson, Michigan — well below half the national median. Prices are up 2.3% over the past year, and the gap between the cheapest and priciest ZIP codes spans more than $110,000.
Quick answer: The average home price in Jackson, MI is $178,956 as of February 2026, up 2.3% year over year according to Zillow.
Current Home Prices in Jackson
Jackson sits in south-central Michigan, about 80 miles west of Detroit. It remains one of the more affordable metro areas in the state.
| Metric | Value |
|---|---|
| Median home price | $178,956 |
| Year-over-year change | +2.3% |
| Lowest ZIP median | $131,461 |
| Highest ZIP median | $242,339 |
| ZIP codes tracked | 3 |
| Data as of | February 2026 |
A 2.3% annual increase works out to roughly $4,000 in added home value over the past year. That’s modest growth — enough to keep pace with inflation but not enough to price out most buyers.
The spread between the cheapest and most expensive ZIP is $110,878. That means where you buy within Jackson matters almost as much as when you buy. A home in the 49202 ZIP costs just 54% of what you’d pay in 49201.
For buyers watching the Michigan market, Jackson offers entry points that cities like Ann Arbor or Grand Rapids can’t match. The median here is a fraction of what those metros demand.
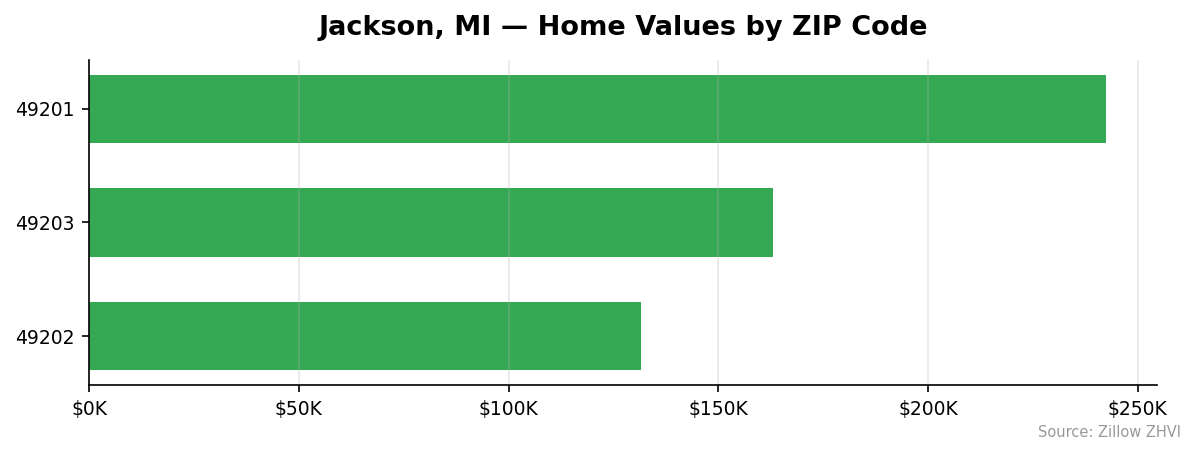
Jackson Home Prices by Neighborhood
All three tracked ZIP codes in Jackson show meaningful price differences.
| ZIP Code | Median Home Value | Avg. Monthly Rent |
|---|---|---|
| 49201 | $242,339 | $1,014 |
| 49203 | $163,069 | $1,165 |
| 49202 | $131,461 | $1,251 |
Most Expensive
49201 tops the list at $242,339 — 35% above the city average. Despite having the highest home values, this ZIP has the lowest average rent at $1,014 per month, which suggests a higher share of owner-occupied homes.
Most Affordable
49202 is the cheapest area at $131,461, about 27% below the city average. Interestingly, it commands the highest rent at $1,251 per month. That inverted relationship between home prices and rents makes 49202 worth a closer look for investors.
49203 falls in the middle at $163,069 with rent averaging $1,165.
Rent vs Buy in Jackson
Rent data is available for all three Jackson ZIP codes. Here’s how the numbers break down.
| ZIP Code | Avg. Monthly Rent | Estimated Mortgage (6.5%, 20% down) |
|---|---|---|
| 49201 | $1,014 | ~$1,226 |
| 49203 | $1,165 | ~$824 |
| 49202 | $1,251 | ~$665 |
The estimated mortgage column assumes a 6.5% rate, 20% down payment, and a 30-year term. It does not include property taxes, insurance, or maintenance.
In 49202 and 49203, the mortgage payment on the median home is lower than average rent. That’s unusual. If you can manage the down payment, buying is cheaper than renting in those neighborhoods on a pure monthly basis.
In 49201, the mortgage runs about $212 more than rent. The higher home prices there push monthly payments above what landlords charge.
City-wide, the average rent across all three ZIPs is roughly $1,143 per month. A mortgage on the city median of $178,956 works out to about $905 before taxes and insurance. For buyers with savings for a down payment, the math favors owning.
Population Growth and Migration
Jackson is losing residents. Not quickly, but the trend is consistent.
| Year | Population |
|---|---|
| 2020 | 31,307 |
| 2021 | 31,196 |
| 2022 | 30,987 |
| 2023 | 30,930 |
| 2024 | 30,920 |
The city shed 387 people between 2020 and 2024, a decline of 1.2%. The losses were steepest early — 320 residents left between 2020 and 2022 — then the pace slowed to a trickle.
Compare that to other Michigan cities:
| City | 2024 Population | 4-Year Growth |
|---|---|---|
| Troy | 89,209 | +2.4% |
| Lansing | 114,336 | +1.6% |
| Detroit | 645,705 | +1.1% |
| Grand Rapids | 200,117 | +0.7% |
| Farmington Hills | 84,173 | +0.4% |
| Jackson | 30,920 | -1.2% |
Every comparison city is growing. Jackson is the outlier. That said, a 1.2% decline over four years isn’t a collapse. It does mean housing demand isn’t getting a boost from population growth. Prices are rising here because of broader market forces, not because of a rush of new residents.
Jackson Housing Market Trends
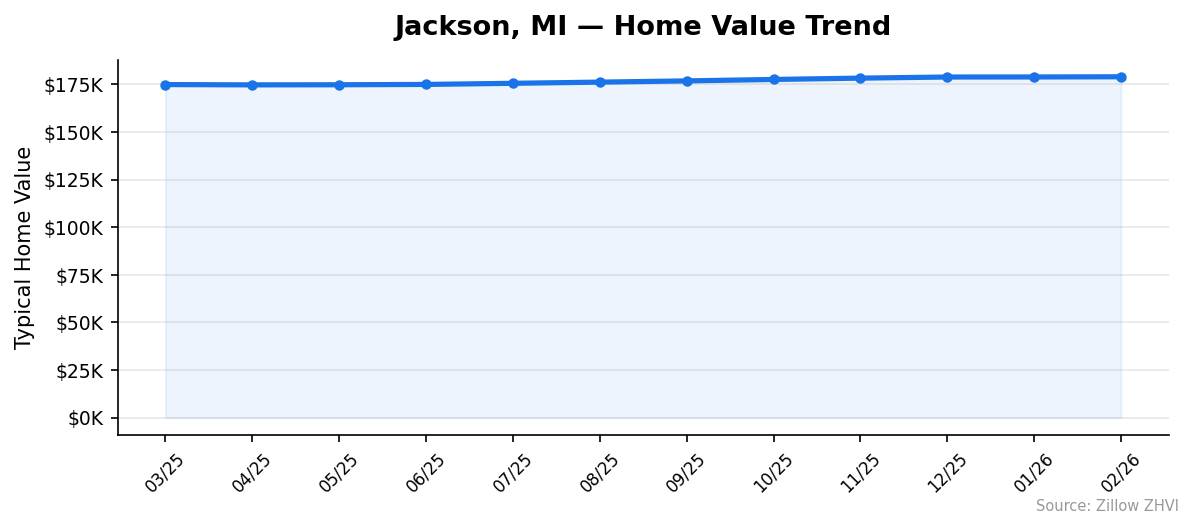
Here’s how the median home price has moved over the past 12 months.
| Month | Median Price | Low ZIP | High ZIP |
|---|---|---|---|
| Feb 2026 | $178,956 | $131,461 | $242,339 |
| Jan 2026 | $178,863 | $131,806 | $242,213 |
| Dec 2025 | $178,835 | $131,839 | $242,345 |
| Nov 2025 | $178,251 | $131,127 | $241,696 |
| Oct 2025 | $177,559 | $130,212 | $240,805 |
| Sep 2025 | $176,798 | $129,310 | $239,745 |
| Aug 2025 | $176,154 | $128,638 | $238,713 |
| Jul 2025 | $175,535 | $127,946 | $237,823 |
| Jun 2025 | $174,940 | $127,452 | $237,076 |
| May 2025 | $174,768 | $127,391 | $237,105 |
| Apr 2025 | $174,717 | $127,642 | $237,112 |
| Mar 2025 | $174,869 | $128,086 | $237,198 |
The trend is a clean upward line. Not a single month of decline. From the March 2025 low of $174,717 to the February 2026 reading of $178,956, the city median gained $4,239 — a 2.4% increase in 12 months.
The pace has been steady rather than sharp. Monthly gains ranged from $93 to $761. No sudden spikes, no pullbacks. That kind of consistency suggests stable demand rather than speculation.
Is Jackson a Good Place to Buy in 2026?
The data points to a buyer-friendly market with caveats.
At $178,956, Jackson is affordable by almost any standard. You can enter the market in ZIP 49202 for under $132,000. Monthly mortgage payments undercut rents in two of three neighborhoods.
The 2.3% annual appreciation is modest. You won’t see explosive equity gains here. But you’re also unlikely to face the kind of rapid price swings that make buyers in hotter markets nervous.
The risk factor is population. Jackson is slowly losing residents while peer cities gain them. A shrinking population can eventually drag on home values, especially if the trend accelerates.
For buyers who work in the region or want a low-cost entry into homeownership, Jackson’s numbers make a strong case. For investors, the rent-to-price ratio in 49202 and 49203 deserves a hard look.
Jackson Housing Market Outlook for 2026-2027
The 12-month trend shows steady, unbroken price increases. If the current pace continues, the median could reach the low $180,000s by mid-2026.
The three-month trend is telling. From December 2025 to February 2026, the median rose $121 — a slower pace than earlier months when gains averaged $500 or more. That deceleration could mean prices are leveling off, or it could reflect normal seasonal softness during winter months.
Spring and summer typically bring more buyer activity. If the pattern from mid-2025 repeats, expect monthly gains to pick back up in the $400 to $700 range through the warmer months.
Nothing in the data suggests a price decline is coming. But the slowing momentum and shrinking population warrant watching.
Similar Markets in MI
If you’re considering Jackson, these Michigan cities offer different price points and growth profiles:
- Detroit — Michigan’s largest city with a population of 645,705 and 1.1% growth over four years.
- Lansing — The state capital, 35 miles north of Jackson, growing at 1.6%.
- Grand Rapids — West Michigan’s largest market at 200,117 residents.
- Ann Arbor — A university town with typically higher prices, about 40 miles east.
- Kalamazoo — Another mid-size Michigan city worth comparing for affordability.
Frequently Asked Questions
What is the average home price in Jackson?
The average home price in Jackson, MI is $178,956 as of February 2026. That figure represents the median across the city’s three tracked ZIP codes, which range from $131,461 in 49202 to $242,339 in 49201.
Are home prices going up or down in Jackson?
Prices are going up. Jackson’s median home value increased 2.3% year over year. The trend has been positive for every month in the past 12-month tracking period, with no monthly declines recorded.
Is it cheaper to rent or buy in Jackson?
It depends on the neighborhood. In ZIP codes 49202 and 49203, the estimated mortgage payment on the median home is actually lower than the average rent. In 49201, where homes are pricier, renting is cheaper on a monthly basis. City-wide, buying tends to be the better deal if you have the down payment.
What is the most affordable neighborhood in Jackson?
ZIP code 49202 is the most affordable at $131,461 — roughly 27% below the city median. Despite having the lowest home prices, this area has the highest average rent at $1,251 per month, creating an attractive ratio for potential buyers or investors.
Methodology
Home values are based on the Zillow Home Value Index (ZHVI), a smoothed measure of typical home values in the 35th to 65th percentile range. Rent estimates use the Zillow Observed Rent Index (ZORI). Population figures come from the U.S. Census Bureau Population Estimates Program (2020-2024 vintage). All datasets are publicly available. Housing data updated 2026-02-28.