Grand Rapids Home Prices: $291K, Up 2.9% — 5 ZIPs Analyzed (2026)
$290,576. That’s the typical home value in Grand Rapids as of February 2026. Prices are up 2.9% over the last year, and they’ve climbed every single month for the past twelve.
Quick answer: The average home price in Grand Rapids, MI is $290,576 as of February 2026, up 2.9% year over year according to Zillow.
Current Home Prices in Grand Rapids
The Grand Rapids market is grinding higher. Steady, not dramatic. Five tracked ZIP codes range from $230,990 on the low end to $368,861 at the top — a $137,000 spread inside city limits.
| Metric | Value |
|---|---|
| Median home value | $290,576 |
| Year-over-year change | +2.9% |
| Lowest ZIP value | $230,990 |
| Highest ZIP value | $368,861 |
| ZIP-to-ZIP spread | $137,871 |
| Data through | February 2026 |
That 2.9% gain runs ahead of nominal wage growth in most Midwest metros, but it’s a softer climb than the double-digit pandemic years. For buyers, the practical takeaway is that waiting hasn’t paid off here. The lowest monthly average in the last twelve months was $282,492 in March 2025. Anyone who held off for a price drop has watched the median rise by more than $8,000 instead.
The metro area is Grand Rapids-Kentwood, MI. The figures here cover the city proper, not the broader metro. ZIP-level values come directly from Zillow’s smoothed home value index, which excludes the bottom and top of the price distribution to filter out outliers like teardowns and luxury estates.
You’re not looking at a frothy market. You’re looking at a slow, methodical climb with no monthly declines in the recent record.
Grand Rapids Home Prices by Neighborhood
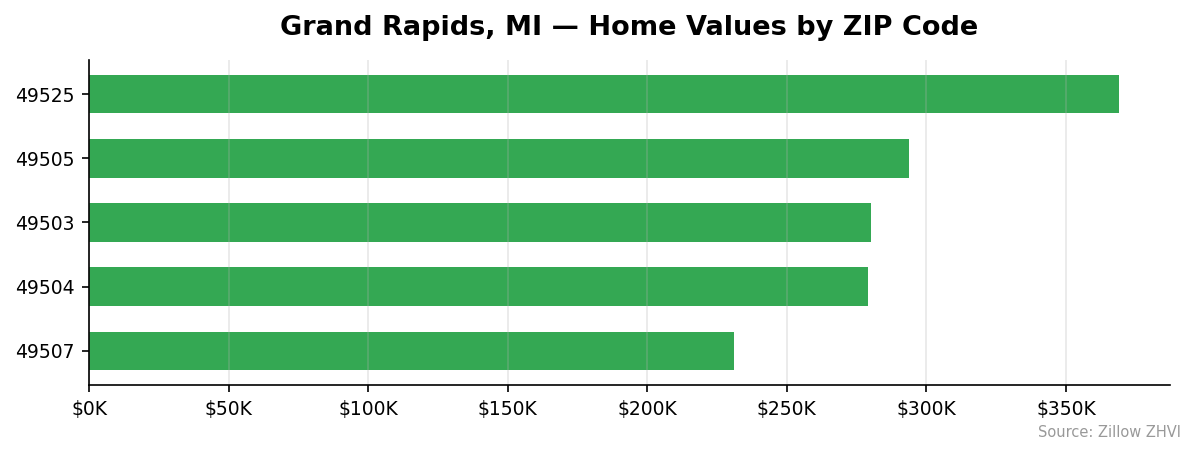
Five ZIP codes, three price tiers. The northeast side at 49525 sits well above the rest, while 49507 anchors the affordable end.
| ZIP Code | Median Value | Avg Rent | vs City Median |
|---|---|---|---|
| 49525 | $368,861 | $1,687 | +27.0% |
| 49505 | $293,906 | $1,677 | +1.1% |
| 49503 | $280,013 | $1,546 | -3.6% |
| 49504 | $279,110 | $1,685 | -3.9% |
| 49507 | $230,990 | $1,697 | -20.5% |
Most Expensive
49525 — $368,861. The northeast and northern fringe of the city, roughly 27% above the city median and the only ZIP that crosses $300K.
49505 — $293,906. Sits just above the city average. Rent runs $1,677, on par with the rest of the city.
49503 — $280,013. Central Grand Rapids, slightly below the city median. The lowest rent in town at $1,546 — about $150 less than other ZIPs.
Most Affordable
49507 — $230,990. The cheapest tracked ZIP by a wide margin. Buy-in is about $60,000 below the city median, but rent is actually the highest at $1,697 — meaning rent-to-price ratios here are stronger for landlords than anywhere else in the city.
49504 — $279,110. Western Grand Rapids. Roughly $11,000 below the median with rent at $1,685.
49503 — $280,013. The third-cheapest ZIP, but the cheapest place to rent in the city.
Rent vs Buy in Grand Rapids
The five ZIPs average $1,658 in monthly rent. The cheapest is 49503 at $1,546. The priciest is 49507 at $1,697 — yes, the same ZIP with the lowest home values.
Now run the buy side. A median home at $290,576 with 20% down ($58,115) leaves a loan of $232,461. At a 7% rate on a 30-year fixed, that’s roughly $1,547 in principal and interest. Add property taxes (Michigan’s effective rate runs around 1.4% of value, or about $339 per month here) and homeowners insurance (estimate $100). Total monthly carry: about $1,986.
| Cost Type | Monthly |
|---|---|
| Average rent (5-ZIP avg) | $1,658 |
| Mortgage P&I (20% down, 7%) | $1,547 |
| Property tax estimate | $339 |
| Insurance estimate | $100 |
| Total ownership cost | $1,986 |
| Difference (own minus rent) | +$328 |
Renting saves about $328 a month on average. But that math flips if you stay long enough. Equity builds with each payment, the home is appreciating at 2.9% annually right now (about $8,400 per year on a median home), and tax-deductible interest helps higher earners.
The break-even depends on how long you stay. Most rent-vs-buy calculators put the crossover in Grand Rapids at four to six years for a buyer with stable income. Below that horizon, rent is the cheaper choice on paper.
Population Growth and Migration
Grand Rapids is gaining people again after a pandemic-era dip.
| Year | Population |
|---|---|
| 2020 | 198,735 |
| 2021 | 197,757 |
| 2022 | 197,694 |
| 2023 | 198,270 |
| 2024 | 200,117 |
The city lost residents in 2021 and 2022 before rebounding. The 2024 estimate of 200,117 is up 1,847 from 2023 alone — the strongest single-year gain in the series. Four-year growth from 2020 to 2024 stands at 0.7%.
How does that compare to the rest of Michigan?
| City | 2024 Population | 4-Year Growth |
|---|---|---|
| Detroit | 645,705 | +1.1% |
| Lansing | 114,336 | +1.6% |
| Sterling Heights | 134,342 | +0.2% |
| Farmington Hills | 84,173 | +0.4% |
| Troy | 89,209 | +2.4% |
| Grand Rapids | 200,117 | +0.7% |
Grand Rapids is growing slower than Troy and Lansing, but it’s outpacing Sterling Heights and Farmington Hills. Detroit has higher percentage growth, but off a much larger base.
For housing demand, this matters. A city adding people creates pressure on supply, which props up prices. Combined with the 12-month price uptrend, the population data points the same direction: more buyers entering the market than leaving it.
Grand Rapids Housing Market Trends
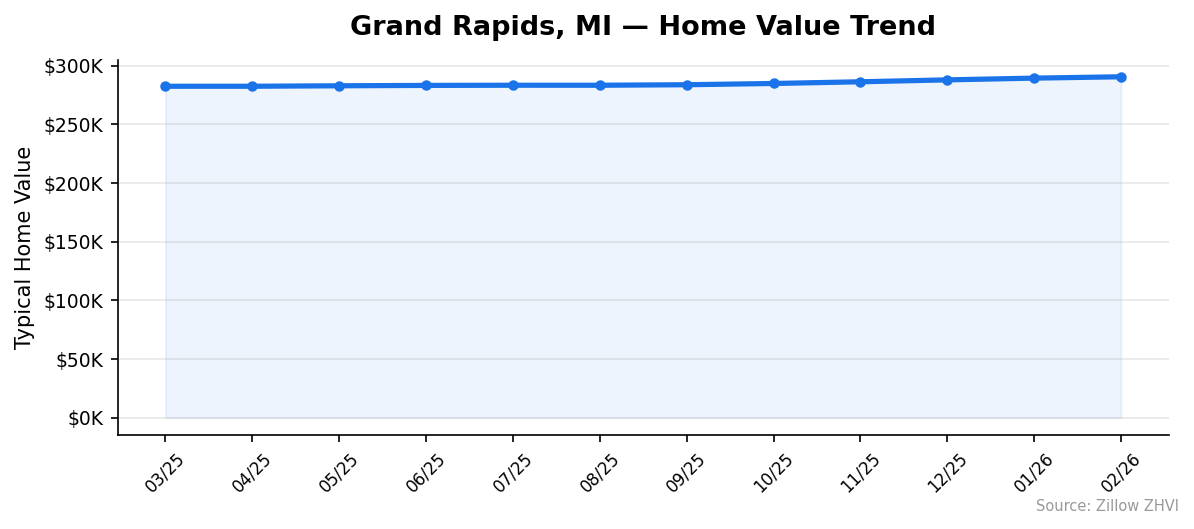
Twelve months. Twelve increases. Not a single monthly decline in the latest data.
| Month | Median Value | Monthly Change |
|---|---|---|
| 2025-03 | $282,492 | — |
| 2025-04 | $282,510 | +$18 |
| 2025-05 | $282,910 | +$400 |
| 2025-06 | $283,225 | +$315 |
| 2025-07 | $283,373 | +$148 |
| 2025-08 | $283,362 | -$11 |
| 2025-09 | $283,796 | +$434 |
| 2025-10 | $284,871 | +$1,075 |
| 2025-11 | $286,317 | +$1,446 |
| 2025-12 | $287,950 | +$1,633 |
| 2026-01 | $289,438 | +$1,488 |
| 2026-02 | $290,576 | +$1,138 |
Two patterns stand out. The market was nearly flat through the summer of 2025 — June, July, and August moved by less than $500 combined. Then prices accelerated sharply starting in October. The last four months alone added $5,705 to the median.
That’s not seasonal noise. That’s directional momentum heading into 2026. November through February typically see slower price growth nationally because inventory thins and buyer activity dips. Grand Rapids defied that pattern.
Is Grand Rapids a Good Place to Buy in 2026?
The data points to a seller’s market, leaning slightly. Here’s why.
Prices are rising every month. Inventory pressure is implied — when values climb steadily without monthly setbacks, supply is tight relative to demand. The population is growing, which adds buyers without adding housing stock at the same pace. ZIP 49507 still offers entry under $231,000, giving budget buyers a real foothold the bigger Michigan markets don’t.
But it’s not a runaway market. The 2.9% annual gain is well below pandemic-era spikes and within the range of normal long-term appreciation. You’re not racing competing offers in 49507 the way buyers were in 2021.
If you can afford the monthly carry and plan to stay four years or more, the math works. If you need flexibility or your job is uncertain, the $328 monthly rent advantage is real. The most affordable buy is in 49507 at $230,990 — that’s a sub-$1,300 mortgage payment with 20% down at current rates.
Grand Rapids Housing Market Outlook for 2026-2027
The 3-month trend is the most useful signal. From November 2025 to February 2026, the median rose from $286,317 to $290,576 — a $4,259 gain in three months, or about $1,420 per month.
If the current pace continues through spring 2026, the median would cross $295,000 by May. That’s not a forecast — it’s an extrapolation. Mortgage rates, inventory shifts, or a soft labor market could break the trend.
The momentum has been accelerating, not decelerating. October added $1,075. November added $1,446. December added $1,633. Each of the last five months has posted a four-figure gain. That kind of consistent acceleration usually doesn’t reverse in a single month.
For buyers, the practical implication: waiting six months has cost about $7,000 in 2025-2026. For sellers, listings entering the market in spring should encounter the strongest pricing power Grand Rapids has seen in two years.
Similar Markets in MI
- Detroit — Michigan’s largest city offers significantly lower price points if Grand Rapids feels stretched.
- Ann Arbor — University-driven market that typically runs above Grand Rapids on price.
- Lansing — State capital with comparable population and slightly faster growth.
- Kalamazoo — Smaller West Michigan market often used as a Grand Rapids alternative.
- Kentwood — Same metro area, just south of Grand Rapids.
Frequently Asked Questions
What is the average home price in Grand Rapids?
The average home price in Grand Rapids, MI is $290,576 as of February 2026. That figure represents the Zillow Home Value Index for the middle range of the market and reflects a $137,000 spread across the five tracked ZIP codes.
Are home prices going up or down in Grand Rapids?
Up. Prices have risen 2.9% year over year and posted gains in twelve consecutive months. The pace has accelerated recently, with the last four months adding more than $5,700 to the median value.
Is it cheaper to rent or buy in Grand Rapids?
Renting is cheaper month-to-month by roughly $328 in Grand Rapids. Average rent runs $1,658, while a mortgage on a median-priced home with 20% down works out to about $1,986 once you include property taxes and insurance. Buying becomes the better deal once you factor in equity and stay four or more years.
What is the most affordable neighborhood in Grand Rapids?
ZIP code 49507 is the cheapest at $230,990 — about $60,000 below the city median. Notably, rents there are the highest in the city at $1,697, which makes it a strong cash-flow target for landlords and the lowest barrier to entry for owner-occupiers.
Methodology
Home values are based on the Zillow Home Value Index (ZHVI), a smoothed measure of typical home values in the 35th to 65th percentile range. Rent estimates use the Zillow Observed Rent Index (ZORI). Population figures come from the U.S. Census Bureau Population Estimates Program (2020-2024 vintage). All datasets are publicly available. Housing data updated 2026-02-28.