Killeen Home Prices: $194K, Down 1.7% — 4 ZIPs Analyzed (2026)
$194K. That’s what a typical home costs in Killeen, TX right now — and the price is heading in the wrong direction for sellers.
The median home value sits at $193,858 as of February 2026, down 1.7% from a year ago. For a military town that’s been a magnet for affordable housing buyers, that dip raises a question: is this a buying opportunity or a sign of deeper softening?
Quick answer: The average home price in Killeen, TX is $193,858 as of February 2026, down 1.7% year over year according to Zillow.
Current Home Prices in Killeen
| Metric | Value |
|---|---|
| Median Home Value | $193,858 |
| Year-over-Year Change | -1.7% |
| Lowest ZIP Median | $120,043 |
| Highest ZIP Median | $256,475 |
| Number of ZIPs Tracked | 4 |
| Data as of | February 2026 |
The spread between Killeen’s cheapest and most expensive ZIP codes is $136,432. That’s a wide gap for a city this size, and it tells you that your experience buying here depends entirely on which side of town you’re looking at.
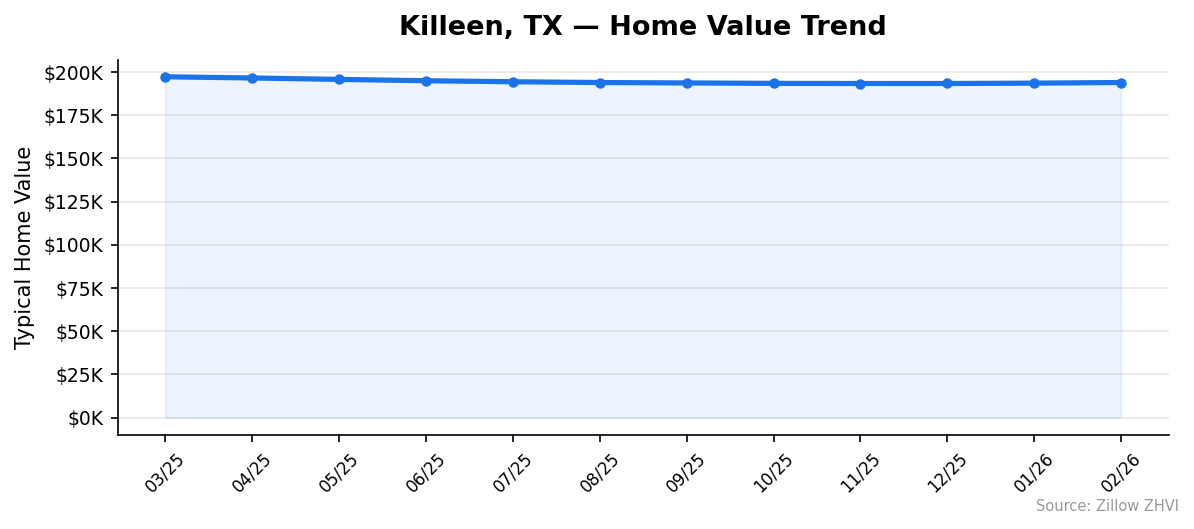
A 1.7% annual decline might not sound dramatic. But prices peaked near $197,164 in March 2025 and have been sliding since. The drop erased roughly $3,300 in typical home value over twelve months.
For buyers, this is straightforward: you’re paying less than you would have a year ago. For sellers, it means pricing right matters more than it did during the pandemic run-up.
Killeen Home Prices by Neighborhood
| ZIP Code | Median Home Value | Avg. Monthly Rent |
|---|---|---|
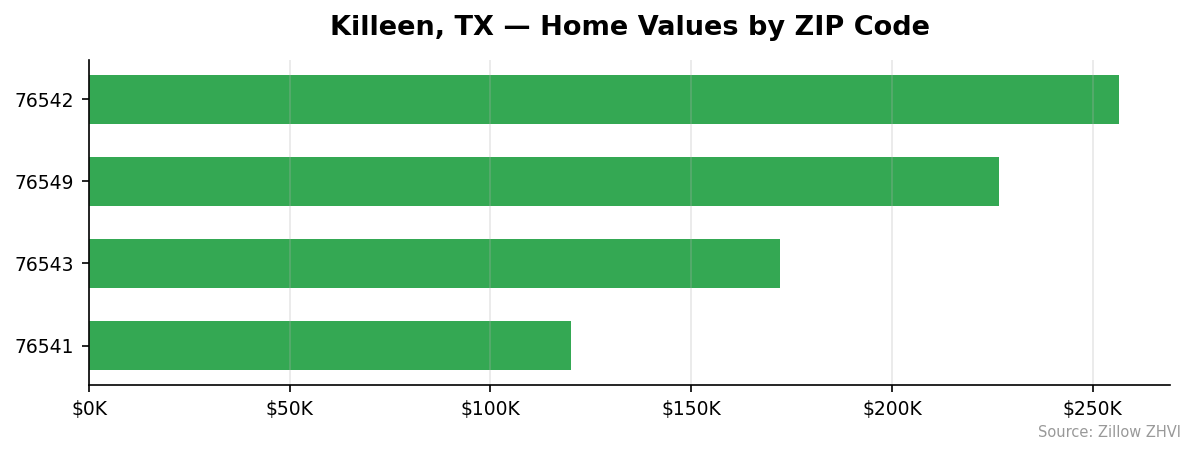
| 76542 | $256,475 | $1,491 |
| 76549 | $226,668 | $1,384 |
| 76543 | $172,247 | $1,167 |
| 76541 | $120,043 | $936 |
Most Expensive
76542 leads at $256,475 — 32% above the city median — with rents to match at $1,491/month. 76549 comes in second at $226,668, sitting 17% above the city average with $1,384 rents.
Most Affordable
76541 is the clear bargain at $120,043 — 38% below the city median. Rent here averages just $936/month. 76543 at $172,247 offers a middle ground, priced 11% below the city average with $1,167 monthly rents.
The gap between 76542 and 76541 is stark. You could buy two homes in 76541 for the price of one in 76542. That kind of variance within a single city gives buyers options — but it also means “Killeen home prices” as a single number hides a lot of nuance.
Rent vs Buy in Killeen
Here’s the rent picture across Killeen’s four tracked ZIP codes:
| ZIP Code | Avg. Rent | Est. Mortgage (5% down, 7%) |
|---|---|---|
| 76542 | $1,491 | ~$1,620 |
| 76549 | $1,384 | ~$1,430 |
| 76543 | $1,167 | ~$1,090 |
| 76541 | $936 | ~$760 |
Estimated mortgage payments assume 5% down and a 7% rate on a 30-year fixed loan, principal and interest only. Taxes, insurance, and PMI would add $200-$400/month depending on the property.
In 76541 and 76543, renting costs more than the base mortgage payment. If you plan to stay three or more years, buying makes financial sense in those ZIPs — especially 76541, where rent runs $936 but P&I would be around $760.
In 76542, the math flips. The mortgage alone runs $1,620 before extras. Add taxes and insurance and you’re looking at $2,000+ per month, well above the $1,491 rent.
The city-wide average rent across all four ZIPs is roughly $1,245/month.
Population Growth and Migration
Killeen’s population hit 160,616 in 2024. That’s a 4.5% increase from 153,758 in 2020.
| Year | Population |
|---|---|
| 2020 | 153,758 |
| 2021 | 157,075 |
| 2022 | 159,374 |
| 2023 | 159,953 |
| 2024 | 160,616 |
Growth has slowed noticeably. Killeen added 3,317 residents between 2020 and 2021, but only 663 between 2023 and 2024. The boom is cooling to a trickle.
How does Killeen compare to other Texas cities?
| City | 2024 Population | 4-Year Growth |
|---|---|---|
| Fort Worth | 1,008,106 | 9.1% |
| San Antonio | 1,526,656 | 6.1% |
| Lubbock | 272,086 | 5.4% |
| Killeen | 160,616 | 4.5% |
| Houston | 2,390,125 | 4.0% |
| Austin | 993,588 | 2.9% |
Killeen’s 4.5% growth sits mid-pack among Texas cities. It outpaces Houston and Austin but trails Fort Worth and San Antonio. The military presence at Fort Cavazos anchors demand, but the slowing growth rate suggests housing demand won’t spike the way it did in 2021.
Killeen Housing Market Trends
Here’s the month-by-month picture over the past year:
| Month | Avg. Home Value | Lowest ZIP | Highest ZIP |
|---|---|---|---|
| Mar 2025 | $197,164 | $123,792 | $257,408 |
| Apr 2025 | $196,481 | $122,721 | $256,912 |
| May 2025 | $195,646 | $121,433 | $256,515 |
| Jun 2025 | $194,876 | $120,203 | $256,198 |
| Jul 2025 | $194,295 | $119,448 | $255,844 |
| Aug 2025 | $193,844 | $118,697 | $255,606 |
| Sep 2025 | $193,601 | $118,479 | $255,638 |
| Oct 2025 | $193,363 | $118,387 | $255,752 |
| Nov 2025 | $193,276 | $118,711 | $255,948 |
| Dec 2025 | $193,283 | $118,841 | $256,236 |
| Jan 2026 | $193,489 | $119,363 | $256,321 |
| Feb 2026 | $193,858 | $120,043 | $256,475 |
The trend tells a clear story in two parts. From March to October 2025, prices fell steadily — dropping $3,801 over seven months. Then the decline bottomed out in November. Since then, prices have ticked up $582.
The cheapest ZIP followed the same pattern but more sharply. It fell from $123,792 to $118,387 (a 4.4% drop) before recovering to $120,043.
The most expensive ZIP held relatively firm throughout, never dropping below $255,606. Expensive neighborhoods weathered the dip better.
Is Killeen a Good Place to Buy in 2026?
The data points to a buyer’s market. Prices are down year over year, and sellers have lost bargaining power.
Three factors work in buyers’ favor. First, the 1.7% annual decline means you’re getting more house per dollar than you were last spring. Second, the cheapest ZIP at $120,043 is genuinely affordable by national standards. Third, the recent flattening suggests you’re not catching a falling knife — the steepest declines appear to be behind us.
The risk: population growth is slowing. If Fort Cavazos sees troop reductions or realignment, housing demand could weaken further. Killeen’s economy is heavily tied to that base.
If you’re buying to live in for five or more years and your monthly payment works at today’s rates, the math is reasonable. If you’re looking for appreciation, the data doesn’t support aggressive expectations.
Killeen Housing Market Outlook for 2026-2027
The three-month trend from December 2025 through February 2026 shows prices inching upward — gaining about $575 over that stretch. If the current pace continues, Killeen could recover to $195,000 by late summer 2026.
But don’t expect a return to the March 2025 peak of $197,164 anytime soon. The year-over-year number is still negative, and population growth is decelerating.
The most likely scenario: prices stabilize in the $193,000-$196,000 range through 2026, with slow seasonal gains in spring and summer followed by the typical fall softening. A breakout above $197K would require a catalyst the current data doesn’t show.
Similar Markets in TX
If you’re shopping Killeen, these Texas cities are worth comparing:
- Houston — a much larger market with similar population growth rates to Killeen (4.0% vs 4.5%)
- San Antonio — another military-influenced market about an hour south
- El Paso — border city with a similar affordability profile and military presence
- Brownsville — among the most affordable metros in Texas
- Dallas — the closest major metro for price comparison
Frequently Asked Questions
What is the average home price in Killeen?
The average home price in Killeen is $193,858 as of February 2026. This is a city-wide median across four tracked ZIP codes. Actual prices range from $120,043 in the most affordable ZIP (76541) to $256,475 in the priciest (76542).
Are home prices going up or down in Killeen?
Down. Killeen home prices have dropped 1.7% year over year. The decline started from a peak of $197,164 in March 2025 and bottomed out around November 2025 at $193,276. Since then, prices have edged up slightly to $193,858 — but they’re still below where they were twelve months ago.
Is it cheaper to rent or buy in Killeen?
It depends on the ZIP code. In 76541 and 76543, monthly mortgage payments (principal and interest only) run below average rents, making buying the cheaper option. In 76542, the most expensive area, renting at $1,491/month costs significantly less than a mortgage plus taxes and insurance. City-wide average rent is roughly $1,245/month.
What is the most affordable neighborhood in Killeen?
ZIP code 76541 is the cheapest area in Killeen with a median home value of $120,043 — 38% below the city average. Rent there averages $936/month. It’s the most accessible entry point for first-time buyers in the Killeen market.
Methodology
Home values are based on the Zillow Home Value Index (ZHVI), a smoothed measure of typical home values in the 35th to 65th percentile range. Rent estimates use the Zillow Observed Rent Index (ZORI). Population figures come from the U.S. Census Bureau Population Estimates Program (2020-2024 vintage). All datasets are publicly available. Housing data updated 2026-02-28.