New Bedford Home Prices: $428K, Up 2.1% — 4 ZIPs Analyzed (2026)
$428,299. That’s what a typical home costs in New Bedford as of February 2026. Prices are up 2.1% over the past year — a modest climb, but the 3-month trend is accelerating faster than the 12-month average.
Quick answer: The average home price in New Bedford, MA is $428,299 as of February 2026, up 2.1% year over year according to Zillow.
Current Home Prices in New Bedford
New Bedford sits in the Providence-Warwick metro, and its pricing reflects that — it’s a ways below Boston but still firmly in the $400K range.
| Metric | Value |
|---|---|
| Median home value | $428,299 |
| Year-over-year change | +2.1% |
| Cheapest ZIP | $413,766 |
| Most expensive ZIP | $441,694 |
| Price spread across ZIPs | $27,928 |
| ZIP codes tracked | 4 |
| Data through | February 2026 |
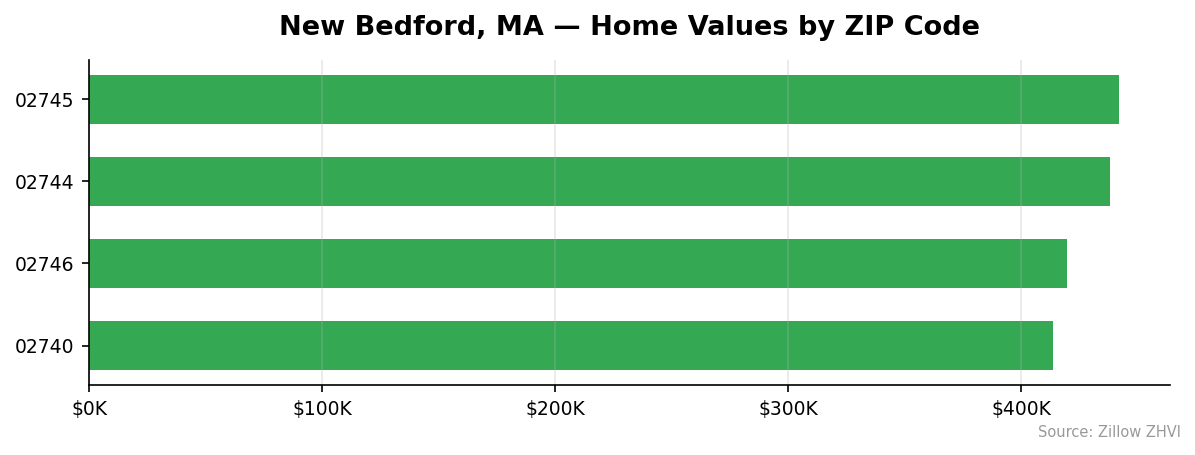
The price spread between New Bedford’s cheapest and priciest ZIPs is roughly $28,000 — about 6.5% of the median. That’s a tight range compared to larger Massachusetts markets. You won’t find a cheap pocket here and a luxury pocket there. The city prices more like one market than four.
Year-over-year growth of 2.1% tracks below Massachusetts’ pricier suburbs but beats most rust-belt comparables. A homeowner who bought last February saw roughly $8,800 in paper gains.
New Bedford Home Prices by Neighborhood
| ZIP Code | Average Value | Vs. City Avg |
|---|---|---|
| 02745 | $441,694 | +$13,395 |
| 02744 | $438,208 | +$9,909 |
| 02746 | $419,526 | -$8,773 |
| 02740 | $413,766 | -$14,533 |
Most Expensive
- 02745 — $441,694. The priciest ZIP sits about 3% above the city average and covers the city’s northern residential stretch.
- 02744 — $438,208. Coastal-adjacent with values running just behind 02745 and a full $24,000 above the cheapest ZIP.
- 02746 — $419,526. A middle-tier ZIP where prices run slightly below the city average but still above $400K.
Most Affordable
- 02740 — $413,766. The cheapest ZIP in New Bedford, covering much of the downtown and older housing stock, with median rent around $1,939/month.
- 02746 — $419,526. Second-cheapest at about $8,800 below the city median.
- 02744 — $438,208. The lowest-priced of the two “coastal” ZIPs, though still above the city average.
Every New Bedford ZIP clears $400K. If that’s your ceiling, this isn’t your city.
Rent vs Buy in New Bedford
Rent data is limited to ZIP 02740, where the median monthly rent is $1,939.
Run the buy math: the $428K median home, with 20% down, leaves a $342,000 loan. At today’s roughly 7% 30-year rate, principal and interest alone come to about $2,275/month. Add Massachusetts property taxes (around 1.1%, or $390/month), homeowner’s insurance (~$150/month), and you’re looking at roughly $2,800/month before any maintenance.
That’s a $900/month gap between renting at $1,939 and buying at ~$2,800. Over a year, renting saves you roughly $10,800 in monthly cash flow.
The break-even argument for buying depends on price appreciation making up that gap. At 2.1% YoY, the typical New Bedford home gains about $8,800/year in value — less than the annual rent-vs-buy spread. On paper, renting wins this year in New Bedford.
That flips if rates drop or appreciation accelerates. But using the data in front of you today, the math favors renters.
Population Growth and Migration
New Bedford added 372 residents between 2020 and 2024 — a 0.4% gain over four years. The city isn’t shrinking, but it isn’t filling up either.
| Year | Population |
|---|---|
| 2020 | 100,946 |
| 2021 | 100,885 |
| 2022 | 100,804 |
| 2023 | 101,007 |
| 2024 | 101,318 |
Notice the dip through 2022, then the recovery. The city lost about 140 residents in the early 2020s before reversing course. 2024’s population is the highest in five years.
Compare that to nearby Massachusetts cities:
| City | 2024 Population | 4-Year Growth |
|---|---|---|
| Worcester | 211,286 | +4.4% |
| Lowell | 120,418 | +4.0% |
| Cambridge | 121,186 | +2.5% |
| Lynn | 103,489 | +2.4% |
| Newton | 90,700 | +2.1% |
| New Bedford | 101,318 | +0.4% |
New Bedford’s 0.4% growth rate is the slowest among its peers. Lynn — a similarly sized city — grew six times faster. Slow population growth limits housing demand pressure, which helps explain why New Bedford’s 2.1% price appreciation trails hotter Massachusetts markets.
New Bedford Housing Market Trends
| Month | Median Value |
|---|---|
| 2026-02 | $428,299 |
| 2026-01 | $425,994 |
| 2025-12 | $423,982 |
| 2025-11 | $421,703 |
| 2025-10 | $420,049 |
| 2025-09 | $418,717 |
| 2025-08 | $417,878 |
| 2025-07 | $417,443 |
| 2025-06 | $417,081 |
| 2025-05 | $417,728 |
| 2025-04 | $418,706 |
| 2025-03 | $419,665 |
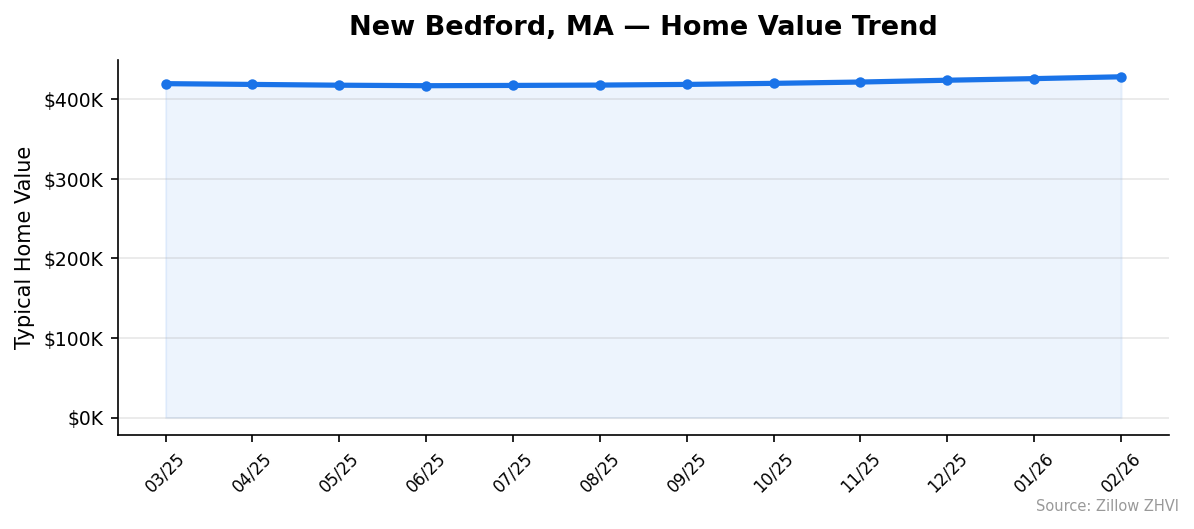
The 12-month arc looks like a U. Prices dipped through spring and early summer 2025, bottomed at $417,081 in June, then climbed every single month since.
From the June low to February’s $428,299, the city added $11,218 in median value — a 2.7% gain in eight months. That’s a faster pace than the 2.1% YoY number suggests, because the YoY figure still carries the softness from last spring.
Month-over-month growth has accelerated too. The past three months averaged $2,200 in gains each, versus roughly $900/month in mid-2025. If you’re a seller, the momentum is finally on your side. If you’re a buyer, the window for the cheap summer dip is gone.
Is New Bedford a Good Place to Buy in 2026?
The data says: it depends on what you need.
For an investor or owner-occupant planning to hold 5+ years, the setup is reasonable. Prices are rising but not spiking. Growth is modest, not frothy. You’re not buying at a peak.
For a short-term buyer, the math is harder. Rent-vs-buy favors renting by roughly $900/month. Annual appreciation ($8,800) doesn’t cover the gap. You’d need a 3-year-plus horizon for appreciation and equity paydown to flip the math.
Population growth is the flag to watch. At 0.4% over four years, New Bedford isn’t drawing the inbound demand that drives Worcester (+4.4%) or Lowell (+4.0%). Without a faster population pace, price growth likely stays in the low single digits.
Verdict: a fine market for patient buyers. Not a rush.
New Bedford Housing Market Outlook for 2026-2027
The 3-month trend shows prices rising about $2,200/month. If the current pace continues, New Bedford’s median would reach roughly $435K by summer 2026 and approach $441K by year end — pushing into what is currently the top-ZIP range.
That pace likely slows. Each of the past four months has been slightly smaller than the one before it (January added $2,012; February added $2,305 — nearly flat). A cooling second derivative often signals the acceleration is near its ceiling.
Population growth of 0.4% caps how fast demand can outrun supply. Barring a shock — rate cuts, a regional job boom — expect the annual pace to settle in the 2-4% range through 2027.
Similar Markets in MA
- Lynn — similar population size but growing six times faster, with different price dynamics
- Lowell — larger and faster-growing, worth checking for buyers who want more demand-side momentum
- Worcester — Massachusetts’ second-largest city, with the state’s strongest population growth among the comparables
- Springfield — western Massachusetts alternative for buyers looking below the $428K New Bedford median
- Boston — the anchor market, useful for framing how far New Bedford sits below metro-Boston pricing
Frequently Asked Questions
What is the average home price in New Bedford?
The average home price in New Bedford is $428,299 as of February 2026. That figure comes from the Zillow Home Value Index, which tracks the typical home in the 35th-65th percentile of each market.
Are home prices going up or down in New Bedford?
Up. Prices rose 2.1% year over year, and the 3-month trend is accelerating — the past three months averaged roughly $2,200 in monthly gains, faster than the annual pace suggests.
Is it cheaper to rent or buy in New Bedford?
Renting is cheaper by roughly $900/month. Median rent in ZIP 02740 runs $1,939; the all-in monthly cost to own the median $428K home is closer to $2,800 at current rates. Appreciation doesn’t close that gap in the short term.
What is the most affordable neighborhood in New Bedford?
ZIP 02740 at $413,766 — about $14,500 below the city average. It’s the only New Bedford ZIP with published rent data, at $1,939/month median.
Methodology
Home values are based on the Zillow Home Value Index (ZHVI), a smoothed measure of typical home values in the 35th to 65th percentile range. Rent estimates use the Zillow Observed Rent Index (ZORI). Population figures come from the U.S. Census Bureau Population Estimates Program (2020-2024 vintage). All datasets are publicly available. Housing data updated 2026-02-28.