Lynnwood Home Prices: $806K, Down 1.6% — 4 ZIPs Analyzed (2026)
$805,806. That is what a typical Lynnwood home is worth right now, and the number is smaller than it was a year ago. Prices are down 1.6% year over year across the city’s four ZIP codes.
Quick answer: The average home price in Lynnwood, WA is $805,806 as of February 2026, down 1.6% year over year according to Zillow.
Current Home Prices in Lynnwood
The citywide median tells one story. The spread between ZIPs tells another.
| Metric | Value |
|---|---|
| Median home value | $805,806 |
| Year-over-year change | -1.6% |
| Cheapest ZIP | $740,851 (98087) |
| Most expensive ZIP | $854,990 (98026) |
| Price spread | $114,139 |
| ZIPs tracked | 4 |
| Metro area | Seattle-Tacoma-Bellevue |
| Data through | February 28, 2026 |
The gap between the top and bottom ZIP is about $114,000, or roughly 15% of the city median. That is a narrower spread than you see in bigger metros, which reflects Lynnwood’s relatively compact geography just north of Seattle.
Context matters here. A year ago, the median was $819,287. The drop since then is real but modest — about $13,500 shaved off a typical home. That is less than a bad month in many 2022 markets, and the softening has mostly played out over the back half of 2025.
If you are pricing a home today, the ceiling for a standard single-family property sits near $855,000 in the strongest ZIP and the floor sits near $741,000 in the softest. Anything outside that band needs a specific story — lot, condition, square footage — to justify the number.
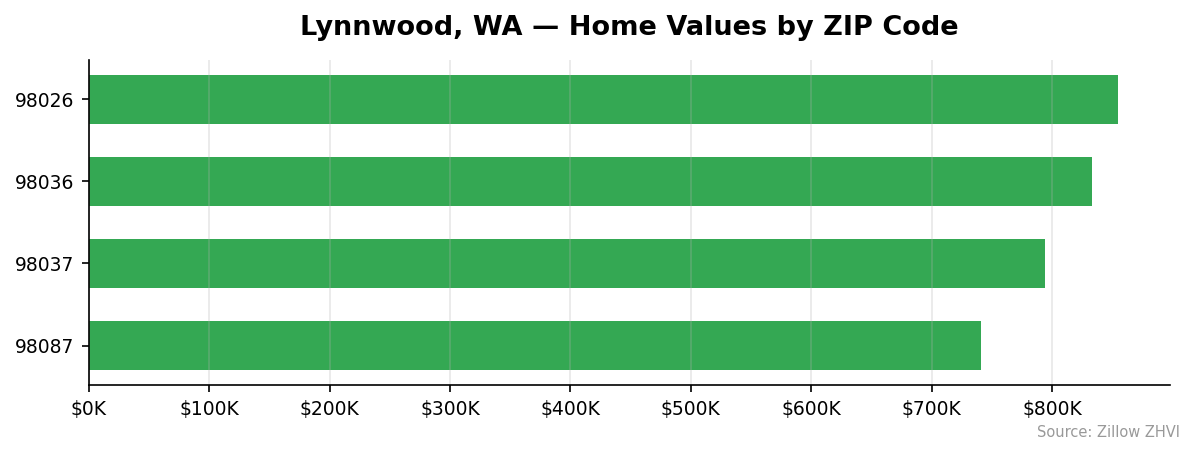
Lynnwood Home Prices by Neighborhood
Four ZIP codes cover the Lynnwood market. Here is how they stack up.
| ZIP | Home Value | Avg Rent | Rent Yield |
|---|---|---|---|
| 98026 | $854,990 | $2,102 | 2.95% |
| 98036 | $833,103 | $2,006 | 2.89% |
| 98037 | $794,281 | $2,092 | 3.16% |
| 98087 | $740,851 | $2,158 | 3.49% |
The cheapest ZIP also produces the highest rent yield. That is unusual and worth noting for investors.
Most Expensive
- 98026 ($854,990) — The top-priced ZIP, about $49,000 above the city median. Rents here come in at $2,102, middle of the pack.
- 98036 ($833,103) — Sits about $27,000 above average. Rents are the lowest of the four at $2,006, giving it the thinnest rent yield.
- 98037 ($794,281) — Below the city median but still above $790,000. Rent holds at $2,092, nearly matching the top ZIP.
Most Affordable
- 98087 ($740,851) — The cheapest ZIP by a wide margin — $65,000 below the city average. Rents actually run highest here at $2,158, which is why its rent-to-price ratio leads the city.
- 98037 ($794,281) — Second cheapest, and the middle ground for buyers who want Lynnwood without the top-end price tag.
- 98036 ($833,103) — Third place by price. Not affordable in absolute terms, but undercuts 98026 by more than $21,000.
Rent vs Buy in Lynnwood
The rent data makes the math unusually clear here.
Average rent across Lynnwood’s four ZIPs is about $2,089 a month. A mortgage on the median $805,806 home looks very different. Put 20% down ($161,000) and finance $644,600 at a 7% fixed rate, and the principal-and-interest payment alone runs about $4,290 a month. Add property taxes (roughly $670 a month at Washington rates) and insurance (call it $150), and the all-in carry is around $5,100.
That is more than double the rent.
Even the cheapest ZIP, 98087, changes the picture only slightly. A 20%-down mortgage on a $740,851 home carries around $4,700 a month all-in. Rent in that ZIP averages $2,158. The ratio stays roughly 2-to-1.
Renting wins on monthly cash flow. Buying only wins if you hold long enough for appreciation and equity to close the gap. With prices down 1.6% year over year, that equity build is not happening through price growth right now — it has to come from paying down principal, which takes years.
The practical read: if you are staying less than five years, rent. If you are staying longer and can absorb the monthly gap, buying starts to make sense, especially in 98087 where the rent yield is highest and the entry price is lowest.
Population Growth and Migration
Lynnwood is one of the faster-growing cities in Washington.
| Year | Population |
|---|---|
| 2020 | 38,549 |
| 2021 | 38,910 |
| 2022 | 40,434 |
| 2023 | 41,069 |
| 2024 | 41,597 |
That is 7.9% growth over four years, or roughly 3,000 new residents. The biggest single-year jump came in 2022.
Compare that to other Washington cities:
| City | 2024 Population | 4-Year Growth |
|---|---|---|
| Lynnwood | 41,597 | +7.9% |
| Seattle | 780,995 | +5.5% |
| Spokane Valley | 108,267 | +4.5% |
| Vancouver | 198,992 | +4.0% |
| Tacoma | 228,202 | +3.8% |
| Everett | 113,011 | +1.9% |
Lynnwood is growing faster than Seattle, Tacoma, and neighboring Everett — in percentage terms, faster than every major comparison city on the list. That matters for housing. When population rises 7.9% over four years and home prices soften 1.6% in the most recent twelve months, demand is not the weak link. Supply or affordability is.
For buyers, that population trajectory is a reason to doubt any narrative that Lynnwood is emptying out. It is not.
Lynnwood Housing Market Trends
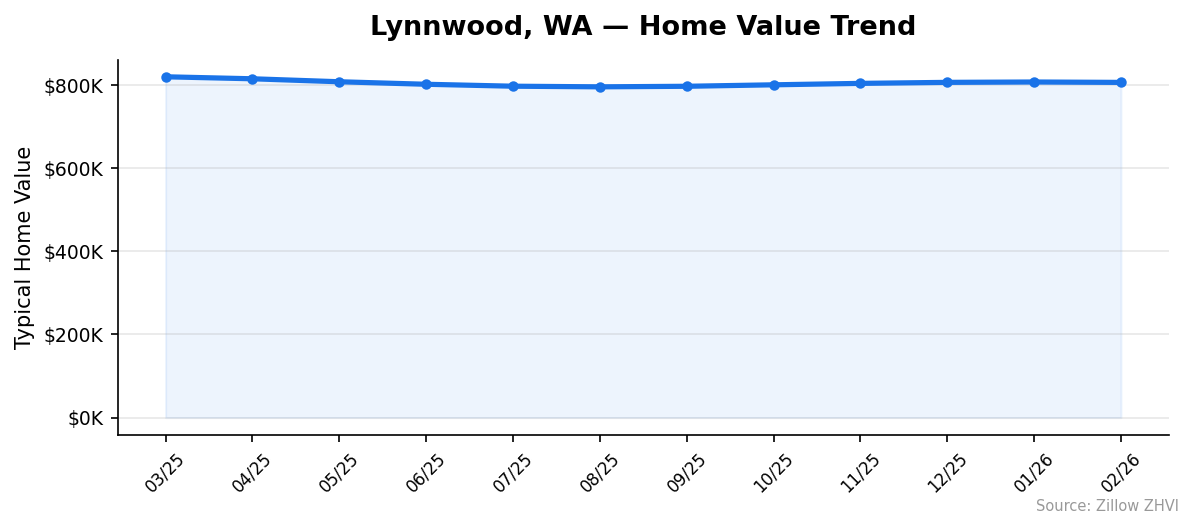
The 12-month arc shows a market that peaked in spring 2025 and has been finding its footing since.
| Month | Median Value |
|---|---|
| March 2025 | $819,287 |
| April 2025 | $814,491 |
| May 2025 | $807,339 |
| June 2025 | $801,314 |
| July 2025 | $796,651 |
| August 2025 | $795,143 |
| September 2025 | $796,466 |
| October 2025 | $799,994 |
| November 2025 | $803,428 |
| December 2025 | $805,892 |
| January 2026 | $806,758 |
| February 2026 | $805,806 |
Prices fell every month from March through August 2025, for a total drop of about $24,000. The bottom hit $795,143 in August.
Then the market turned. September through January posted five straight months of gains, recovering almost half the peak-to-trough loss. February showed a tiny pullback of about $950 — essentially flat.
The pattern is a classic bottoming sequence: sharp decline, shallow bounce, sideways drift. The market is not racing back to the 2025 peak, but it has stopped falling.
Is Lynnwood a Good Place to Buy in 2026?
The data points to a balanced market leaning slightly toward buyers.
Prices are down 1.6% year over year. The 12-month trough is behind you. Population is growing faster than most Washington cities. Rent yields are modest but positive, topping out at 3.49% in 98087.
For a buyer with a long time horizon, the combination of a mild price correction, a growing population base, and a proven Seattle-metro commuter location is workable. You are not buying the bottom, but you are no longer buying the top either.
For a short-term buyer, the rent-vs-buy math is brutal. Renting saves roughly $3,000 a month over owning the median home. That is $36,000 a year — enough to change the calculation if you are not committed to five-plus years.
Sellers face a tougher market than a year ago. Homes are worth $13,000 less than they were in March 2025, and any listing priced against last spring’s comps will sit.
Lynnwood Housing Market Outlook for 2026-2027
The three-month trend suggests stability, not a rebound.
From December 2025 through February 2026, the median moved $805,892 → $806,758 → $805,806. That is a range of under $1,000 across three months, which is noise, not direction.
If the current pace continues, Lynnwood enters spring 2026 roughly where it sits now — near $806,000, give or take the usual seasonal bump that shows up in most Western Washington markets. The back half of 2025’s recovery from the August low suggests underlying demand is there, but the February flattening argues against expecting another strong leg up.
A reasonable working assumption for the next six months: prices in the $795,000 to $820,000 band. Anything outside that range would require a new signal — a rate move, a jobs shock, or an inventory shift — that is not visible in the data available now.
Similar Markets in WA
- Seattle — The anchor market for the metro. Lynnwood buyers priced out of Seattle proper often land here.
- Everett — Just north of Lynnwood along I-5. Slower population growth but worth comparing on price.
- Bothell — The closest peer market geographically, sitting east of Lynnwood.
- Shoreline — Directly south, between Lynnwood and Seattle. A common substitute for buyers who want closer-in.
- Bellingham — Further north and typically cheaper. An option for buyers willing to commute or work remote.
Frequently Asked Questions
What is the average home price in Lynnwood?
The average home price in Lynnwood, WA is $805,806 as of February 2026. That figure is based on the Zillow Home Value Index across the city’s four ZIP codes.
Are home prices going up or down in Lynnwood?
Prices are down 1.6% year over year. The median hit $819,287 in March 2025, fell to $795,143 by August, and has partially recovered to $805,806 as of February 2026.
Is it cheaper to rent or buy in Lynnwood?
Renting is cheaper by a wide margin today. Average rent runs about $2,089 a month, while the all-in monthly cost of owning the median $805,806 home with 20% down comes to roughly $5,100 — about 2.4 times the rent.
What is the most affordable neighborhood in Lynnwood?
ZIP 98087 is the cheapest, with a typical home value of $740,851. It also carries the highest average rent at $2,158, giving it the best rent yield of any Lynnwood ZIP at 3.49%.
Methodology
Home values are based on the Zillow Home Value Index (ZHVI), a smoothed measure of typical home values in the 35th to 65th percentile range. Rent estimates use the Zillow Observed Rent Index (ZORI). Population figures come from the U.S. Census Bureau Population Estimates Program (2020-2024 vintage). All datasets are publicly available. Housing data updated 2026-02-28.