Yakima Home Prices: $359K, Up 1.4% — 4 ZIPs Analyzed (2026)
$358,731. That’s what a typical Yakima home costs as of February 2026. Prices are up 1.4% over the past 12 months — a slow climb, but a climb.
Quick answer: The average home price in Yakima, WA is $358,731 as of February 2026, up 1.4% year over year according to Zillow.
Current Home Prices in Yakima
The Yakima housing market sits in a different universe from Seattle or Bellingham. You pay far less. You also see far slower appreciation.
Here’s the snapshot:
| Metric | Value |
|---|---|
| Median home value | $358,731 |
| Year-over-year change | +1.4% |
| Lowest ZIP median | $292,215 (98902) |
| Highest ZIP median | $421,215 (98908) |
| Price range spread | $129,000 |
| ZIP codes tracked | 4 |
| Data month | February 2026 |
The gap between the cheapest and priciest ZIP runs about $129,000 — a meaningful spread in a city this size. Buyers shopping on price have room to move down. Buyers shopping on neighborhood pay a clear premium.
A 1.4% annual gain is modest. It beats a decline. It trails inflation in most 2026 forecasts. If you bought a median-priced Yakima home a year ago, your equity grew by roughly $4,950 on paper — before you count mortgage principal paydown.
That matters for your buy-or-wait math. A market appreciating at this pace rewards patience less than one running hot. It also punishes impatient sellers less.
Yakima Home Prices by Neighborhood
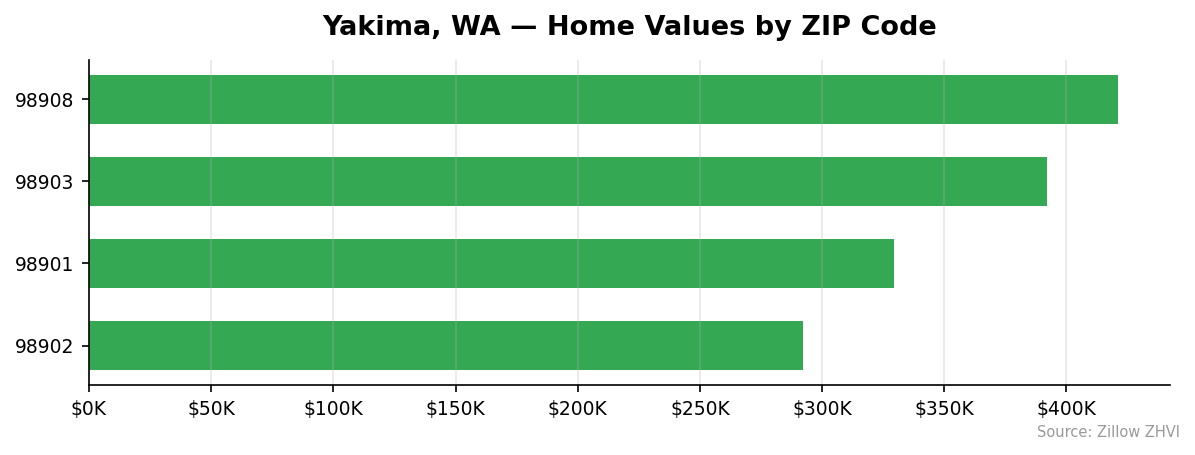
Four ZIPs carry the Yakima market. Prices range from the high $280s to the low $420s.
| ZIP Code | Median Home Value | Monthly Rent |
|---|---|---|
| 98908 | $421,215 | $1,832 |
| 98903 | $391,934 | Not available |
| 98901 | $329,559 | $975 |
| 98902 | $292,215 | $1,156 |
Most Expensive
98908 — $421,215. About 17% above the city median and the priciest ZIP by a clear margin. Rent here also tops the list at $1,832 per month.
98903 — $391,934. Roughly 9% over the city median. No rent data is available for this ZIP, so renter demand is harder to read.
98901 — $329,559. Slightly below the median. The $975 rent figure is the lowest of the three tracked ZIPs, suggesting weaker rental demand than price alone would predict.
Most Affordable
98902 — $292,215. The cheapest ZIP, about 18% below the city median. Oddly, rent runs $1,156 — higher than 98901 despite lower home values. That rent-to-price ratio favors landlords.
98901 — $329,559. Second cheapest. A median-priced buyer here would pay about $29,000 less than the city average.
98903 — $391,934. The bottom of the upper tier, not truly affordable by city standards.
Rent vs Buy in Yakima
Rent data covers three of four Yakima ZIPs. Average monthly rent across those three: $1,321.
| ZIP | Monthly Rent |
|---|---|
| 98908 | $1,832 |
| 98902 | $1,156 |
| 98901 | $975 |
Now the buy side. A $358,731 median home with 20% down leaves a $286,985 loan. At a 7% fixed 30-year rate, principal and interest alone run about $1,910 per month. Add property tax, homeowner’s insurance, and maintenance, and your all-in carrying cost sits closer to $2,400-$2,600.
Do the math: renting the average Yakima home saves you roughly $1,100 per month versus buying at today’s rates.
That gap doesn’t mean buying is wrong. You build equity. Rent payments buy nothing. But the monthly cash flow difference is real, and with 1.4% annual appreciation, the market isn’t bailing out overextended buyers the way a hot market would.
If you’re staying under three years, the numbers favor renting. If you’re staying seven-plus years, buying usually wins once you account for principal paydown and any appreciation.
Population Growth and Migration
Yakima barely moves. The population grew from 97,084 in 2020 to 97,390 in 2024 — a 0.3% gain over four years.
| Year | Population |
|---|---|
| 2020 | 97,084 |
| 2021 | 96,793 |
| 2022 | 96,622 |
| 2023 | 96,904 |
| 2024 | 97,390 |
The city lost residents from 2020 through 2022, then clawed back. Net result after four years: flat.
Compare that to the rest of Washington:
| City | 2024 Population | 4-Year Growth |
|---|---|---|
| Seattle | 780,995 | +5.5% |
| Spokane Valley | 108,267 | +4.5% |
| Vancouver | 198,992 | +4.0% |
| Tacoma | 228,202 | +3.8% |
| Everett | 113,011 | +1.9% |
| Yakima | 97,390 | +0.3% |
Yakima grows at roughly one-sixth the rate of Everett, the slowest-growing city in this comparison. What does flat population mean for housing? Demand pressure is minimal. You don’t get the kind of bidding wars or price spikes that follow newcomers. Supply and demand stay close to balance. That explains the modest 1.4% appreciation — there’s no surge of buyers competing for scarce inventory.
Yakima Housing Market Trends
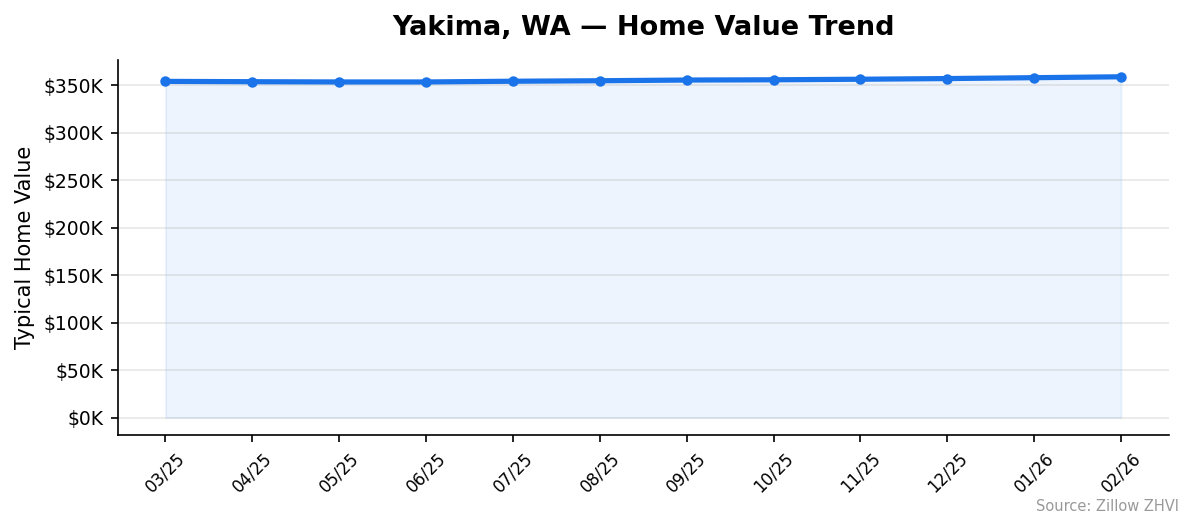
Yakima home values have risen every single month over the past year.
| Month | Median Value | Monthly Change |
|---|---|---|
| Feb 2026 | $358,731 | +$943 |
| Jan 2026 | $357,788 | +$932 |
| Dec 2025 | $356,856 | +$702 |
| Nov 2025 | $356,154 | +$579 |
| Oct 2025 | $355,575 | +$260 |
| Sep 2025 | $355,315 | +$743 |
| Aug 2025 | $354,572 | +$523 |
| Jul 2025 | $354,049 | +$759 |
| Jun 2025 | $353,290 | +$2 |
| May 2025 | $353,288 | -$271 |
| Apr 2025 | $353,559 | -$342 |
| Mar 2025 | $353,901 | — |
The story: a soft spring in 2025 (two small monthly dips in April and May), then eight straight months of gains through February 2026. The pace is accelerating. The last three months added about $2,577 — roughly triple the gain from spring.
This isn’t a runaway market. It’s a steady one. That consistency matters if you’re timing a purchase. You’re unlikely to get a surprise discount waiting three more months.
Is Yakima a Good Place to Buy in 2026?
It depends on your goal.
For appreciation chasers, Yakima disappoints. A 1.4% annual gain won’t build wealth fast. Seattle, Spokane Valley, and Vancouver all pull in more buyers and likely deliver stronger price growth.
For affordability seekers, Yakima works. The $358,731 median is a fraction of the $900K+ you’d pay in Seattle. A median Yakima household can realistically buy here. That’s increasingly rare on the west side of the state.
For investors, the rent-to-price ratios in ZIPs 98902 and 98908 look reasonable, though the broader rent data is thin.
The market leans balanced, with a slight tilt toward sellers given eight consecutive months of price gains. Expect standard negotiations — not desperate bidding, not deep discounts.
Yakima Housing Market Outlook for 2026-2027
The 3-month trend suggests continued gains. February 2026 added $943. January added $932. December added $702. The pace has been climbing each month.
If the current pace continues, Yakima prices will cross $360K in the next two to three months. The dip seen in April and May 2025 could repeat this spring — seasonal softness often shows up in Washington markets as inventory rises — but the underlying momentum points up.
Population growth of 0.3% won’t ignite a boom. Expect the next 6-12 months to look like the last 12: slow, steady, boring. That’s actually good news if you’re buying. You have time to shop. You have room to negotiate. You don’t need to waive inspections.
Similar Markets in WA
If Yakima prices work for you, these Washington cities have similar data pages worth reading:
- Kennewick — another eastern Washington market on the same side of the Cascades.
- Spokane — larger eastern Washington metro with more ZIPs to analyze.
- Bellingham — a price-jump north if you’re considering western Washington alternatives.
- Olympia — state capital market with different dynamics from Yakima’s.
- Vancouver — southwest Washington city with 4% population growth, much stronger demand.
Frequently Asked Questions
What is the average home price in Yakima?
The average home price in Yakima, WA is $358,731 as of February 2026. That figure reflects the Zillow Home Value Index blended across the four ZIP codes tracked inside the city.
Are home prices going up or down in Yakima?
Prices are up 1.4% year over year. More telling: values have risen every month for eight straight months, with gains accelerating from $260 in October to $943 in February 2026.
Is it cheaper to rent or buy in Yakima?
Renting is cheaper by roughly $1,100 per month. Average rent across three tracked ZIPs is about $1,321, while a median-priced mortgage with taxes, insurance, and maintenance runs closer to $2,400-$2,600 at current rates.
What is the most affordable neighborhood in Yakima?
ZIP 98902 at $292,215. That’s about 18% below the city median of $358,731 and $129,000 less than the priciest ZIP (98908 at $421,215).
Methodology
Home values are based on the Zillow Home Value Index (ZHVI), a smoothed measure of typical home values in the 35th to 65th percentile range. Rent estimates use the Zillow Observed Rent Index (ZORI). Population figures come from the U.S. Census Bureau Population Estimates Program (2020-2024 vintage). All datasets are publicly available. Housing data updated 2026-02-28.