Bellingham Home Prices: $661K, Up 0.4% — 3 ZIPs Analyzed (2026)
$661,495. That’s what a typical home in Bellingham is worth as of February 2026. Prices are up 0.4% from a year ago — barely moving, but moving in the right direction for sellers.
Quick answer: The average home price in Bellingham, WA is $661,495 as of February 2026, up 0.4% year over year according to Zillow.
Current Home Prices in Bellingham
The Bellingham market has flattened out. After a long run of appreciation, the past twelve months have delivered less than a half-percent gain. That’s a different market than the one buyers faced in 2021 or 2022.
Here are the numbers you need:
| Metric | Value |
|---|---|
| Median home value | $661,495 |
| Year-over-year change | +0.4% |
| Most affordable ZIP | $637,661 |
| Most expensive ZIP | $688,072 |
| Price spread (city) | $50,411 |
| ZIP codes tracked | 3 |
| Data month | February 2026 |
The spread between Bellingham’s cheapest and most expensive ZIP is about $50,000. That’s tight. In bigger metros you see spreads of $200,000 or more. Here, your ZIP choice matters less than your offer strategy.
The $661K median puts Bellingham well above the national typical home value. If you’re coming from Seattle or the Bay Area, it will feel affordable. If you’re comparing to Spokane or Yakima, it won’t.
One thing the data shows clearly: the market is stable, not hot. A 0.4% annual gain sits below inflation. That means buyers aren’t being priced out of the market at the pace they were two years ago, and sellers can’t count on appreciation doing the work for them.
Bellingham Home Prices by Neighborhood
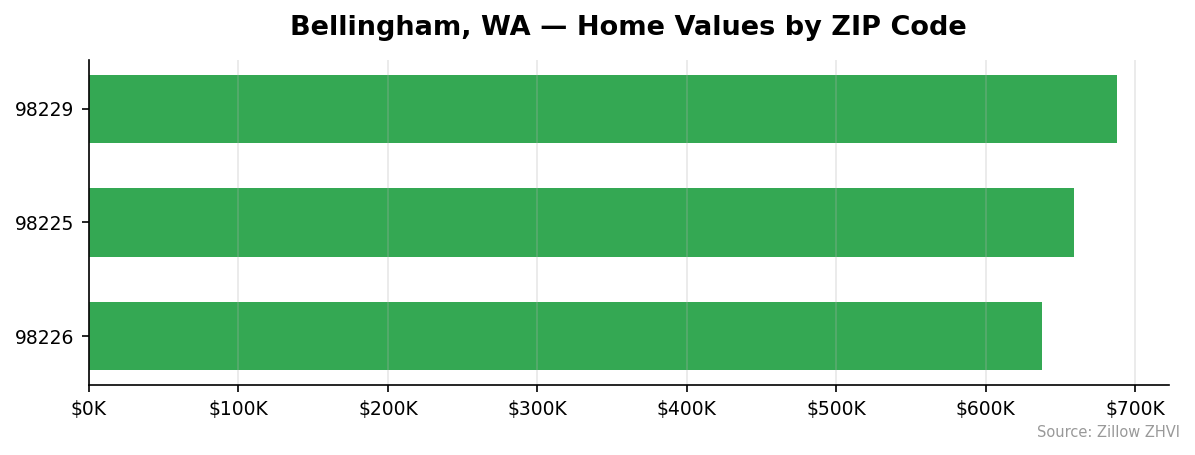
Three ZIP codes cover Bellingham. The range is narrow, but the gap between top and bottom is real money.
| ZIP | Typical Value | Avg Rent | Position |
|---|---|---|---|
| 98229 | $688,072 | $2,207 | Highest |
| 98225 | $658,752 | $1,820 | Middle |
| 98226 | $637,661 | $2,029 | Lowest |
Most Expensive
98229 leads at $688,072, roughly $26,500 above the city median. Rents there also top the list at $2,207, suggesting stronger demand for both owning and renting in that area.
98225 sits in the middle at $658,752, close to the citywide average. Rents of $1,820 are actually the lowest of the three ZIPs — an unusual pattern where a mid-tier sale price pairs with the lowest rent.
Most Affordable
98226 is the bottom of the Bellingham market at $637,661, about $23,800 under the city median. Rent there runs $2,029, higher than in pricier 98225. That gap between sale price and rent makes 98226 worth a second look for investors.
With only three ZIPs, Bellingham’s neighborhood map is simple. Your tradeoff isn’t which side of town — it’s whether the extra $50K for 98229 buys you enough to matter.
Rent vs Buy in Bellingham
Rent wins on monthly cost. The math isn’t close.
Average rent across Bellingham’s three ZIPs is about $2,019 a month. That includes 98229 at $2,207, 98226 at $2,029, and 98225 at $1,820.
Now the buy side. A 20% down payment on the $661,495 median home is $132,299. Financing the remaining $529,196 at a 7% 30-year fixed rate puts principal and interest around $3,521. Add property taxes and insurance — roughly $700 to $800 combined in Washington — and your monthly housing cost lands near $4,200.
That’s more than double the average rent.
A renter paying $2,019 keeps $2,180 a month that a buyer is spending on the house. Over a year, that’s $26,160. Buyers do build equity, but at a 0.4% annual appreciation rate, the home value is adding only about $2,650 a year to net worth — nowhere near closing the gap.
Rent makes sense if you might leave Bellingham in the next four or five years. Buying only starts to pencil out if you stay long enough for appreciation to catch up and principal paydown to build real equity.
Population Growth and Migration
Bellingham added residents. The population went from 91,870 in 2020 to 95,860 in 2024. That’s a 4.3% gain over four years — modest but steady.
| Year | Population |
|---|---|
| 2020 | 91,870 |
| 2021 | 90,444 |
| 2022 | 93,917 |
| 2023 | 95,026 |
| 2024 | 95,860 |
The dip in 2021 stands out. After that, the city posted three straight years of growth.
How does Bellingham compare to other Washington cities?
| City | 2024 Population | 4-Year Growth |
|---|---|---|
| Seattle | 780,995 | +5.5% |
| Spokane Valley | 108,267 | +4.5% |
| Bellingham | 95,860 | +4.3% |
| Vancouver | 198,992 | +4.0% |
| Tacoma | 228,202 | +3.8% |
| Everett | 113,011 | +1.9% |
Bellingham’s 4.3% growth clears the state’s larger metros other than Seattle and Spokane Valley. That kind of pace supports housing demand without triggering the supply crunch you see in faster-growing Sunbelt cities.
For the housing market, the takeaway is simple: people are still moving to Bellingham. That puts a floor under prices even in a slow-appreciation environment.
Bellingham Housing Market Trends
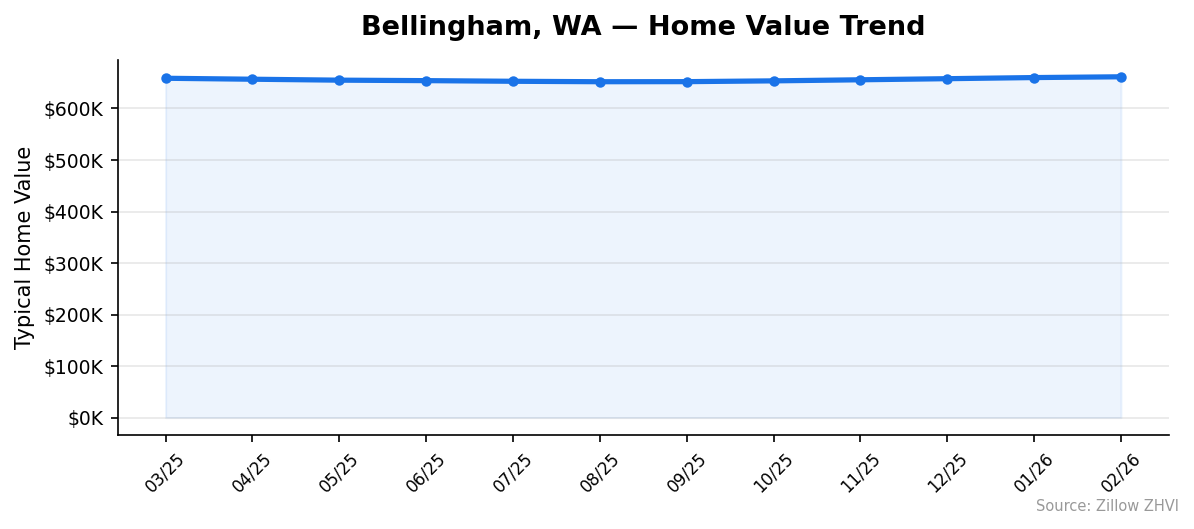
Prices dropped for five months, then climbed for six. The 12-month window tells a clearer story than the year-over-year number alone.
| Month | Typical Value |
|---|---|
| Mar 2025 | $658,629 |
| Apr 2025 | $656,764 |
| May 2025 | $654,948 |
| Jun 2025 | $654,024 |
| Jul 2025 | $652,779 |
| Aug 2025 | $651,915 |
| Sep 2025 | $652,063 |
| Oct 2025 | $653,584 |
| Nov 2025 | $655,680 |
| Dec 2025 | $657,806 |
| Jan 2026 | $659,991 |
| Feb 2026 | $661,495 |
August 2025 was the bottom at $651,915. From there, the market has added about $9,580 over six months — roughly $1,600 a month.
That’s a gentle climb, not a boom. But it’s a clear reversal from the spring and summer slide. Whatever was cooling the market earlier in 2025 has eased.
The year-over-year number of +0.4% undersells what’s happening right now. If you annualize the last six months, Bellingham is appreciating at closer to 3%.
Is Bellingham a Good Place to Buy in 2026?
The data points to a balanced market leaning slightly in sellers’ favor.
Prices are rising, not falling. That removes one major risk for buyers — you’re not catching a falling knife. But the 6-month rebound of 1.5% is far from the double-digit years of 2021 and 2022. You’re not going to get bailed out by fast appreciation either.
Rent is meaningfully cheaper. If you’re not sure you’ll stay in Bellingham for at least five years, renting is the safer financial choice. The $2,180 monthly gap between renting and buying is real money.
Population growth of 4.3% over four years supports demand. The city keeps adding people, which limits downside risk on home values.
The short answer: Bellingham in 2026 is a reasonable buy if you’re settled, have a 20% down payment ready, and plan to stay. It’s not a bargain. It’s not overpriced either.
Bellingham Housing Market Outlook for 2026-2027
If the current pace continues, Bellingham prices will keep grinding higher at a slow rate. The 3-month trend shows values moving up about $1,500 to $2,200 per month.
That puts the near-term direction clearly positive, but modest. Nothing in the data points to a surge or a crash in the next 3 to 6 months.
Two things to watch. First, the summer slowdown of 2025 suggests Bellingham’s market is sensitive to seasonal and rate-driven pressure. If rates climb again, another soft patch is possible. Second, the city has only three ZIP codes in this dataset — local demand can shift quickly in smaller markets.
A buyer today should expect to be paying about what the next buyer pays six months from now, give or take a percent. That’s a planning window, not a reason to rush.
Similar Markets in WA
- Bothell — a higher-priced Seattle-area market if Bellingham feels too modest for your budget.
- Everett — similar city size with slower population growth and different price dynamics.
- Olympia — another mid-sized Washington city worth comparing on price and rent.
- Spokane — buyers priced out of Bellingham often look east for cheaper options.
- Vancouver — a larger Washington city on the Oregon border with comparable growth.
Frequently Asked Questions
What is the average home price in Bellingham?
The average home price in Bellingham, WA is $661,495 as of February 2026. Individual ZIP codes range from $637,661 in 98226 to $688,072 in 98229.
Are home prices going up or down in Bellingham?
Prices are up 0.4% year over year. The market bottomed in August 2025 at $651,915 and has risen every month since, adding about $9,580 over six months.
Is it cheaper to rent or buy in Bellingham?
Renting is cheaper by a wide margin. Average rent is roughly $2,019, while a 20%-down mortgage on the median home runs about $4,200 a month including taxes and insurance — a monthly gap of more than $2,100.
What is the most affordable neighborhood in Bellingham?
ZIP 98226 is the most affordable at $637,661, about $23,800 below the city median. Rent there averages $2,029, slightly above the citywide rent average.
Methodology
Home values are based on the Zillow Home Value Index (ZHVI), a smoothed measure of typical home values in the 35th to 65th percentile range. Rent estimates use the Zillow Observed Rent Index (ZORI). Population figures come from the U.S. Census Bureau Population Estimates Program (2020-2024 vintage). All datasets are publicly available. Housing data updated 2026-02-28.