McKinney Home Prices: $475K, Down 6.1% — 4 ZIPs Analyzed (2026)
Twelve straight months of decline. That’s where the McKinney housing market stands heading into spring 2026. The typical home here has shed over $31,000 in value since March 2025, and the slide isn’t letting up.
The median home in McKinney now costs $475,391 — down 6.1% from a year ago. For a city that saw explosive growth during the pandemic boom, the correction is real.
Quick answer: The average home price in McKinney, TX is $475,391 as of February 2026, down 6.1% year over year according to Zillow.
Current Home Prices in McKinney
| Metric | Value |
|---|---|
| Median Home Price | $475,391 |
| Year-over-Year Change | -6.1% |
| Lowest ZIP Median | $417,266 |
| Highest ZIP Median | $518,448 |
| Number of ZIPs Tracked | 4 |
| Data As Of | February 2026 |
The $475,391 median puts McKinney well above the Texas state average but below its own peak. The gap between the cheapest and most expensive ZIP codes is just over $101,000 — a relatively tight spread for a city this size.
That -6.1% year-over-year number matters. It means a home worth $506,000 last March has lost roughly $31,000 in paper value. If you bought at the peak, your equity has taken a hit. If you’ve been waiting on the sidelines, you’re getting a discount that didn’t exist 12 months ago.
The price range across McKinney’s four tracked ZIP codes — $417,266 to $518,448 — means the city still has options for buyers at different price points, though none of them qualify as cheap by national standards.
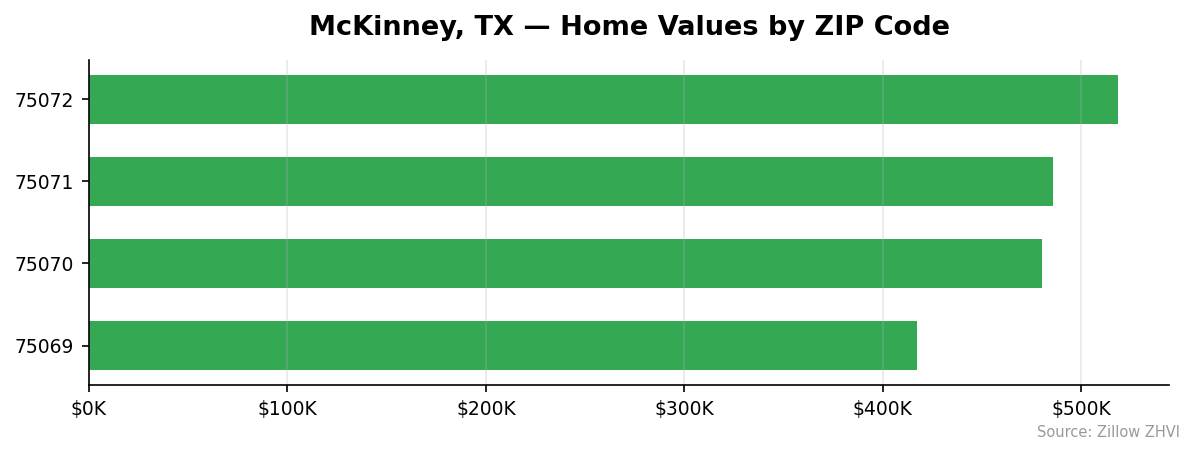
McKinney Home Prices by Neighborhood
| ZIP Code | Median Home Value | Monthly Rent |
|---|---|---|
| 75069 | $417,266 | $1,616 |
| 75070 | $479,971 | $1,581 |
| 75071 | $485,877 | $1,895 |
| 75072 | $518,448 | $2,231 |
Most Expensive
75072 tops the list at $518,448 — about 9% above the city median — with rents to match at $2,231/month, the highest in McKinney.
75071 comes in second at $485,877, roughly 2% above the city average, with rents at $1,895/month.
75070 sits just above the median at $479,971, though it has the lowest rents in the city at $1,581/month — an unusual disconnect between home values and rental demand.
Most Affordable
75069 is McKinney’s most affordable ZIP at $417,266, a full 12% below the city average. Rents here are $1,616/month, making it the best value for both buyers and renters.
The spread between 75069 and 75072 is $101,182. You could buy in the cheapest ZIP and still be in McKinney proper, saving six figures compared to the priciest neighborhood.
Rent vs Buy in McKinney
Renting wins on monthly cash flow right now.
The average rent across McKinney’s four ZIPs is approximately $1,831/month. A mortgage on the median $475,391 home — assuming 20% down, a 7% rate, and a 30-year term — runs about $2,530/month in principal and interest alone. Add property taxes and insurance, and you’re likely north of $3,200.
That’s a $1,400/month gap before you even factor in maintenance and HOA fees.
| ZIP | Monthly Rent | Est. Mortgage (P&I) | Difference |
|---|---|---|---|
| 75069 | $1,616 | $2,222 | -$606 |
| 75070 | $1,581 | $2,555 | -$974 |
| 75071 | $1,895 | $2,587 | -$692 |
| 75072 | $2,231 | $2,760 | -$529 |
The mortgage estimates above are principal and interest only on an 80% loan at 7%.
Buying still builds equity, of course. But with prices falling 6.1% year over year, that equity-building argument weakens. If values drop another 5%, a buyer today could be underwater relative to a renter who invested the monthly savings.
For now, renting gives you flexibility in a declining market.
Population Growth and Migration
McKinney is growing fast — faster than almost any major city in Texas.
| Year | Population |
|---|---|
| 2020 | 197,510 |
| 2021 | 203,530 |
| 2022 | 208,534 |
| 2023 | 215,862 |
| 2024 | 227,526 |
That’s a 15.2% jump in four years. McKinney added 30,016 residents between 2020 and 2024 — roughly 7,500 per year.
Here’s how that growth rate compares to other Texas cities:
| City | 2024 Population | 4-Year Growth |
|---|---|---|
| McKinney | 227,526 | 15.2% |
| Fort Worth | 1,008,106 | 9.1% |
| San Antonio | 1,526,656 | 6.1% |
| Lubbock | 272,086 | 5.4% |
| Houston | 2,390,125 | 4.0% |
| Austin | 993,588 | 2.9% |
McKinney’s growth rate nearly doubles Fort Worth’s and is five times Austin’s. People are moving here. New construction has kept pace, which partly explains why prices are falling despite strong demand — supply caught up.
The tension between rapid population growth and declining prices tells you something: builders overshot. There are enough homes to go around, and then some.
McKinney Housing Market Trends
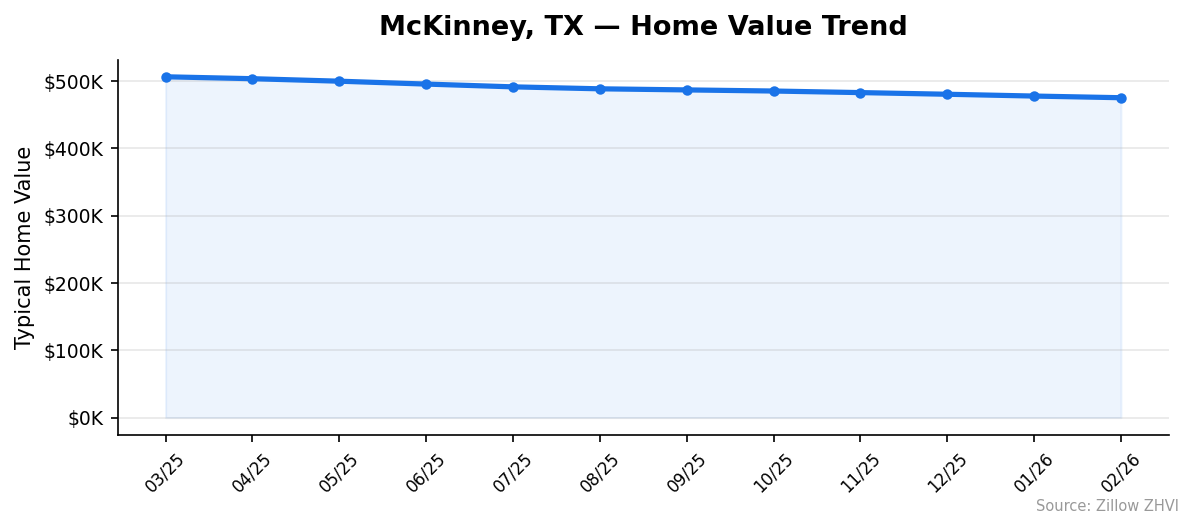
Prices have fallen every single month over the past year.
| Month | Average Value | Low | High |
|---|---|---|---|
| Feb 2026 | $475,391 | $417,266 | $518,448 |
| Jan 2026 | $477,862 | $419,007 | $520,909 |
| Dec 2025 | $480,544 | $420,906 | $523,755 |
| Nov 2025 | $483,000 | $422,689 | $526,471 |
| Oct 2025 | $485,343 | $424,136 | $529,179 |
| Sep 2025 | $486,996 | $425,175 | $531,114 |
| Aug 2025 | $488,631 | $426,307 | $533,087 |
| Jul 2025 | $491,543 | $429,005 | $536,516 |
| Jun 2025 | $495,662 | $432,811 | $541,278 |
| May 2025 | $499,957 | $436,910 | $545,729 |
| Apr 2025 | $503,670 | $440,313 | $549,430 |
| Mar 2025 | $506,499 | $442,719 | $552,005 |
The decline has been steady, not sudden. Each month chips away another $2,000 to $4,000. From the March 2025 high of $506,499 to the current $475,391, McKinney has lost $31,108 in median value — a 6.1% drop.
The pace hasn’t accelerated. The monthly drops in late 2025 and early 2026 are smaller than those in the summer of 2025. In June-to-July alone, prices fell $4,119. By January-to-February, the drop was $2,471. The bleeding is slowing, but it hasn’t stopped.
Is McKinney a Good Place to Buy in 2026?
This is a buyer’s market by the numbers. Prices are down, inventory is implied by the consistent declines, and sellers have less bargaining power than they did a year ago.
But “buyer’s market” doesn’t mean “buy right now.”
If you’re planning to stay five or more years, the 6.1% discount from last year is real money — roughly $31,000 you don’t have to finance. The city’s population growth supports long-term demand. McKinney isn’t shrinking. It added 30,000 people in four years.
If you’re looking short-term, the trend is your enemy. Prices have dropped for 12 consecutive months with no sign of a bottom yet. Buying into a declining market means your home could be worth less next year than what you paid.
The rent-versus-buy math also favors patience. Renting is $600 to $1,000 cheaper per month than owning in every ZIP code.
For long-term buyers with stable income: McKinney offers better value today than at any point in the past year. For everyone else: wait and watch.
McKinney Housing Market Outlook for 2026-2027
The 12-month trend points in one direction: down. But the rate of decline is slowing.
In the first half of the tracked period (March–August 2025), prices fell about $17,868. In the second half (September 2025–February 2026), they fell $11,605. The deceleration is clear.
If the current pace continues — roughly $2,400 to $2,500 per month — you’d expect the median to land somewhere in the $460,000 range by mid-2026. But seasonal demand typically picks up in spring and summer, which could slow or pause the decline.
The 3-month trend from December 2025 to February 2026 shows average monthly drops of $2,577. If that holds through summer, McKinney could find a floor near $465,000 to $470,000.
Population growth remains strong. At some point, demand absorbs the excess supply. The question is when, not if.
Similar Markets in TX
If you’re exploring McKinney, these Texas markets are worth a look:
- Dallas — the metro anchor, with different price dynamics than its northern suburbs
- Grand Prairie — a DFW alternative that typically runs below McKinney’s price point
- Katy — Houston suburb with a similar growth-suburb profile
- San Antonio — significantly more affordable, with its own population boom
- Sugar Land — another master-planned community city, useful for price comparison
Frequently Asked Questions
What is the average home price in McKinney?
The average home price in McKinney is $475,391 as of February 2026. Prices range from $417,266 in ZIP 75069 to $518,448 in ZIP 75072. The city-wide median has dropped over $31,000 in the past 12 months.
Are home prices going up or down in McKinney?
Down. McKinney home prices have fallen for 12 consecutive months, with a year-over-year decline of 6.1%. The median has dropped from $506,499 in March 2025 to $475,391 in February 2026. The rate of decline is slowing but has not reversed.
Is it cheaper to rent or buy in McKinney?
Renting is cheaper. Average rent across McKinney runs about $1,831/month, while a mortgage on the median-priced home costs roughly $2,530/month in principal and interest alone. The gap widens further when you add taxes and insurance.
What is the most affordable neighborhood in McKinney?
ZIP code 75069 has the lowest median home value in McKinney at $417,266 — about 12% below the city average. Rent in 75069 is $1,616/month. It’s the best entry point for buyers who want a McKinney address without paying McKinney’s top-end prices.
Is McKinney growing or shrinking?
McKinney is growing rapidly. Its population jumped from 197,510 in 2020 to 227,526 in 2024 — a 15.2% increase. That growth rate outpaces every major Texas city, including Fort Worth (9.1%), San Antonio (6.1%), and Austin (2.9%).
Methodology
Home values are based on the Zillow Home Value Index (ZHVI), a smoothed measure of typical home values in the 35th to 65th percentile range. Rent estimates use the Zillow Observed Rent Index (ZORI). Population figures come from the U.S. Census Bureau Population Estimates Program (2020-2024 vintage). All datasets are publicly available. Housing data updated 2026-02-28.