Mesquite Home Prices: $268K, Down 4.6% — 3 ZIPs Analyzed (2026)
Twelve straight months of decline. That’s what buyers in Mesquite, TX are watching right now. The typical home here has lost $13,000 in value since March 2025, and the slide hasn’t stopped.
Quick answer: The average home price in Mesquite, TX is $268,479 as of February 2026, down 4.6% year over year according to Zillow.
Current Home Prices in Mesquite
Here’s where the market stands right now:
| Metric | Value |
|---|---|
| Median Home Value | $268,479 |
| Year-over-Year Change | -4.6% |
| Lowest ZIP Value | $235,438 |
| Highest ZIP Value | $318,732 |
| ZIP Codes Tracked | 3 |
| Data as of | February 2026 |
$268K puts Mesquite well below the broader Dallas-Fort Worth metro. For a city of 150,000 people sitting 15 minutes east of downtown Dallas, that price point still draws attention from buyers priced out of the core.
But the direction matters more than the number. A 4.6% annual drop means a home worth $281K last spring is now worth $268K. That’s real money — roughly $13,000 gone from the typical homeowner’s equity in one year.
The spread between the cheapest and most expensive ZIP codes is $83,294. That’s a wide gap for a city with only three tracked ZIP codes, and it tells you that location within Mesquite matters a lot.
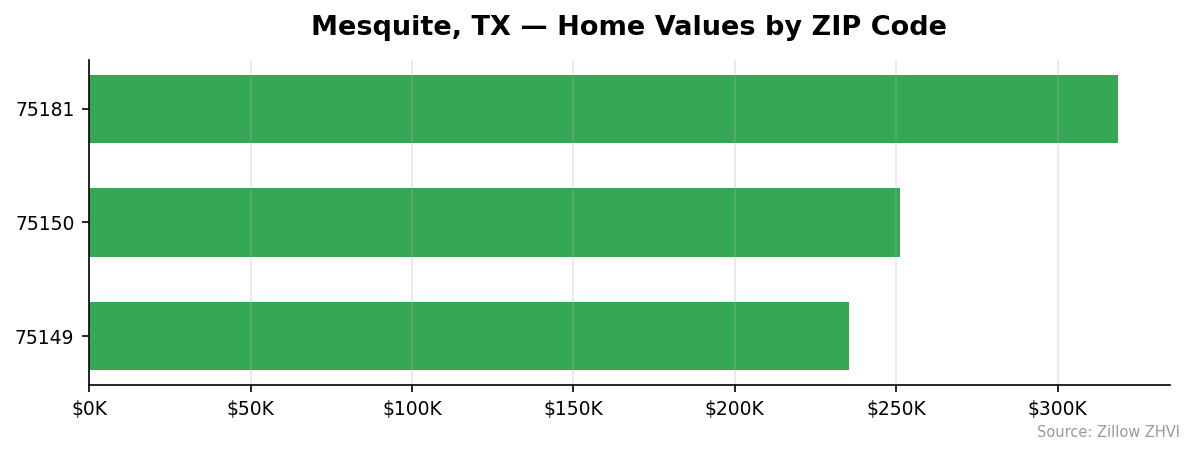
Mesquite Home Prices by Neighborhood
All three Mesquite ZIP codes and their current home values:
| ZIP Code | Median Home Value | Median Rent |
|---|---|---|
| 75181 | $318,732 | $2,491 |
| 75150 | $251,269 | $1,320 |
| 75149 | $235,438 | $1,541 |
Most Expensive
75181 leads at $318,732 — nearly 19% above the city median. Rents here are the highest in Mesquite at $2,491/month, reflecting the area’s position as the premium pocket of the city.
Most Affordable
75149 comes in at $235,438, about $33,000 below the city average. Despite lower home prices, rents in 75149 actually run $1,541/month — higher than in 75150. That rent-to-price gap makes 75149 worth a closer look for investors.
75150 sits in the middle at $251,269 with the lowest rents in the city at $1,320/month.

Rent vs Buy in Mesquite
Rent varies sharply across Mesquite’s three ZIP codes.
| ZIP Code | Median Rent | Home Value | Monthly Rent |
|---|---|---|---|
| 75149 | $1,541 | $235,438 | $1,541 |
| 75150 | $1,320 | $251,269 | $1,320 |
| 75181 | $2,491 | $318,732 | $2,491 |
Take 75149 as an example. A $235,438 purchase with 20% down means a $188,350 mortgage. At current rates near 7%, your principal and interest payment runs about $1,253/month. Add property taxes and insurance, and you’re likely at $1,700–$1,900 total. That’s above the $1,541 rent for the same area.
In 75150, the math is tighter. Rent at $1,320 is low enough that buying could make sense if you plan to stay long-term, even with the carrying costs on a $251K home.
In 75181, rent at $2,491 is high — but so is the purchase price at $319K. With values still falling, renters in this ZIP get to wait without losing equity.
The short answer: renting is cheaper than buying in most of Mesquite right now, especially when you factor in the 4.6% price decline eating into equity.
Population Growth and Migration
Mesquite’s population barely moved over four years.
| Year | Population |
|---|---|
| 2020 | 149,637 |
| 2021 | 147,737 |
| 2022 | 148,271 |
| 2023 | 149,026 |
| 2024 | 150,140 |
The city actually lost about 1,900 residents between 2020 and 2021, then clawed back slowly. By 2024 the population hit 150,140 — a net gain of just 503 people over four years, or 0.3% growth.
Compare that to other Texas cities:
| City | 2024 Population | 4-Year Growth |
|---|---|---|
| Fort Worth | 1,008,106 | 9.1% |
| San Antonio | 1,526,656 | 6.1% |
| Lubbock | 272,086 | 5.4% |
| Houston | 2,390,125 | 4.0% |
| Austin | 993,588 | 2.9% |
| Mesquite | 150,140 | 0.3% |
Mesquite is growing, but just barely. Fort Worth added population 30 times faster on a percentage basis. Flat population growth means housing demand isn’t getting a boost from new residents — one more factor behind the price softness.
Mesquite Housing Market Trends
The 12-month trend tells a clear story: down every single month.
| Month | Avg Home Value | Low (ZIP) | High (ZIP) |
|---|---|---|---|
| Feb 2026 | $268,479 | $235,438 | $318,732 |
| Jan 2026 | $268,654 | $235,154 | $319,628 |
| Dec 2025 | $268,766 | $234,733 | $320,502 |
| Nov 2025 | $268,899 | $234,435 | $321,275 |
| Oct 2025 | $269,287 | $234,579 | $322,188 |
| Sep 2025 | $270,118 | $235,286 | $323,125 |
| Aug 2025 | $271,378 | $236,548 | $324,100 |
| Jul 2025 | $272,926 | $238,050 | $325,340 |
| Jun 2025 | $274,893 | $239,858 | $327,234 |
| May 2025 | $277,020 | $241,558 | $329,695 |
| Apr 2025 | $279,308 | $243,293 | $332,422 |
| Mar 2025 | $281,442 | $244,930 | $334,929 |
From $281,442 to $268,479 — that’s a $12,963 drop in 12 months. The decline rate held steady at roughly $1,000–$1,100 per month, with no sign of leveling off.
The most expensive ZIP dropped from $334,929 to $318,732, losing $16,197. The cheapest ZIP actually held up better, falling only about $9,500 from $244,930 to $235,438. Lower-priced homes have shown more resilience.
Is Mesquite a Good Place to Buy in 2026?
The data points toward a buyer’s market. Prices are falling, population growth is flat, and there’s no upward momentum visible in any of the 12 months of data.
If you’re a buyer, time is on your side. Every month of waiting has saved roughly $1,000 on the typical Mesquite home. You have negotiating power that didn’t exist two years ago.
If you’re a seller, the window to list at peak prices has passed. The city’s high point was somewhere around early 2025, and values have dropped about 4.6% since then.
For investors, 75149 has an interesting profile — the lowest purchase price but a rent of $1,541 that outpaces the cheaper 75150. Run the cap rate numbers carefully, though, because falling values can eat into returns.
The strongest case for buying now: you plan to stay 5+ years and you’re buying in the affordable ZIPs where the decline has been milder.
Mesquite Housing Market Outlook for 2026-2027
The 12-month trend shows a remarkably consistent decline — about $1,000 per month, every month, without acceleration or deceleration. If the current pace continues through 2026, you’d expect values to drift into the low $260K range by late summer.
The three-month trend from December 2025 to February 2026 shows $287 in monthly decline. That’s slower than the $1,400/month pace from the spring and summer of 2025. The decline may be losing steam, but it hasn’t stopped.
Two things to watch: mortgage rate movements and the broader DFW metro job market. Mesquite’s flat population suggests the city isn’t attracting new demand on its own. Any recovery will likely be driven by metro-wide forces rather than local ones.
Don’t expect a sharp rebound. The most likely scenario is a slow grind lower through mid-2026, with the possibility of stabilization by late 2026 if rates ease.
Similar Markets in TX
Buyers looking at Mesquite should also consider these Texas markets:
- Grand Prairie — a DFW neighbor with a similar suburban profile
- Dallas — the core city next door, with a wider range of price points
- Houston — Texas’s largest city, with sprawling inventory and different price dynamics
- San Antonio — a more affordable major metro farther south
- El Paso — one of the most affordable cities in the state
Frequently Asked Questions
What is the average home price in Mesquite?
The average home price in Mesquite is $268,479 as of February 2026. Prices range from $235,438 in ZIP 75149 to $318,732 in ZIP 75181. The city-wide median sits well below the broader Dallas-Fort Worth metro average.
Are home prices going up or down in Mesquite?
Down. Mesquite home prices have fallen 4.6% year over year and declined every single month for the past 12 months. The typical home lost about $12,963 in value from March 2025 to February 2026.
Is it cheaper to rent or buy in Mesquite?
Renting is generally cheaper right now. In the most affordable ZIP (75149), rent runs $1,541/month while a mortgage on a $235K home — with taxes and insurance — would likely exceed $1,700/month. In 75150, rent is just $1,320, making it the cheapest option across the city.
What is the most affordable neighborhood in Mesquite?
ZIP code 75149 is the most affordable at $235,438 — about $33,000 below the city median. It offers the lowest entry point for buyers, though its rent at $1,541 is actually higher than 75150’s $1,320.
Methodology
Home values are based on the Zillow Home Value Index (ZHVI), a smoothed measure of typical home values in the 35th to 65th percentile range. Rent estimates use the Zillow Observed Rent Index (ZORI). Population figures come from the U.S. Census Bureau Population Estimates Program (2020-2024 vintage). All datasets are publicly available. Housing data updated 2026-02-28.