Oceanside Home Prices: $885K, Down 1.6% — 4 ZIPs Analyzed (2026)
$884,920. That’s what a typical home costs in Oceanside right now — and it’s actually less than it was a year ago.
The San Diego County beach city saw prices slip 1.6% over the past twelve months. After peaking near $900K in early 2025, the market has cooled across all four ZIP codes. For buyers who’ve been priced out of San Diego proper, the question is whether this dip represents opportunity or the start of something bigger.
Quick answer: The average home price in Oceanside, CA is $884,920 as of February 2026, down 1.6% year over year according to Zillow.
Current Home Prices in Oceanside
| Metric | Value |
|---|---|
| Median Home Value | $884,920 |
| Year-over-Year Change | -1.6% |
| Lowest ZIP Price | $770,445 |
| Highest ZIP Price | $1,103,854 |
| Number of ZIPs Tracked | 4 |
| Data as of | February 2026 |
The $885K median puts Oceanside well above the national average but below nearby San Diego. The spread between the cheapest and priciest ZIP codes is $333K — a gap wide enough to mean entirely different buyer profiles depending on the neighborhood.
That 1.6% annual decline translates to roughly $14,400 in lost value on the median home. Not a crash by any measure, but a clear shift from the appreciation buyers had grown used to. Every month since March 2025 has posted a lower average than the one before it.
The price range across Oceanside’s four tracked ZIPs — from $770K to $1.1M — shows this isn’t a single market. It’s four distinct ones sharing a city name.
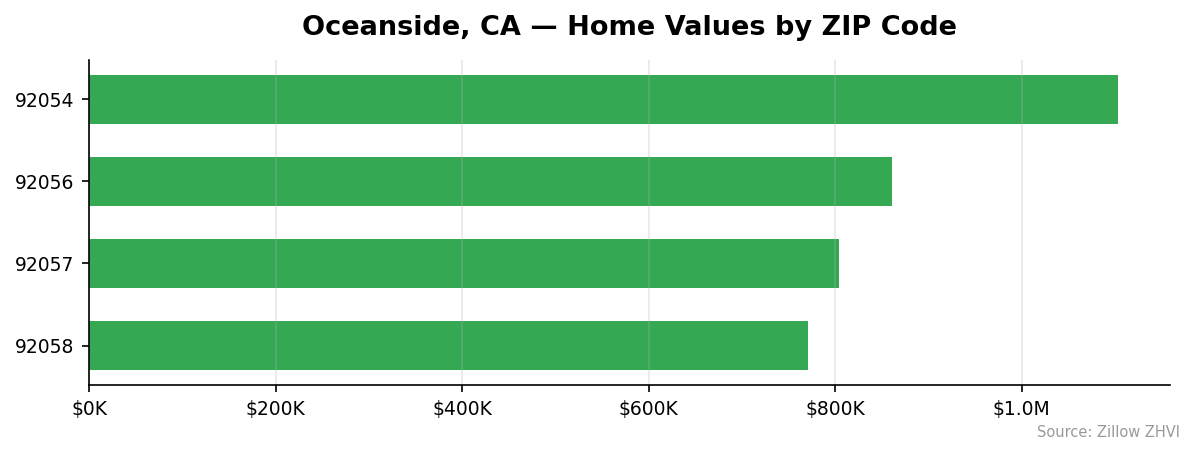
Oceanside Home Prices by Neighborhood
| ZIP Code | Median Home Value | Typical Rent |
|---|---|---|
| 92054 | $1,103,854 | $3,144/mo |
| 92056 | $861,420 | $2,906/mo |
| 92057 | $803,962 | $2,969/mo |
| 92058 | $770,445 | $2,675/mo |
Most Expensive
92054 dominates at $1,103,854 — the only Oceanside ZIP to cross the million-dollar mark. It carries the highest rents too, at $3,144/month, reflecting its coastal positioning. This ZIP alone is 25% above the city median.
Most Affordable
92058 is the entry point at $770,445, roughly $115K below the city average. Despite being the cheapest to buy, it also has the lowest rents at $2,675/month. 92057 comes in next at $803,962, though it commands slightly higher rents than 92058 — an oddity worth watching if you’re evaluating rental income potential.
The gap between 92054 and 92058 is $333,409. You could buy a condo in some U.S. cities for that difference alone.
Rent vs Buy in Oceanside
Renting wins on monthly cash flow right now. Here’s the math.
| ZIP | Monthly Rent | Est. Mortgage Payment* |
|---|---|---|
| 92054 | $3,144 | ~$5,530 |
| 92056 | $2,906 | ~$4,315 |
| 92057 | $2,969 | ~$4,025 |
| 92058 | $2,675 | ~$3,860 |
*Estimated at 6.5% rate, 20% down, principal and interest only. Does not include taxes, insurance, or HOA.
Even in the most affordable ZIP, buying costs roughly $1,185 more per month than renting. In 92054, the gap balloons to nearly $2,400/month.
The rent-to-price ratio tells the same story. At $2,906/month rent on an $861K home (92056), you’re looking at a price-to-rent ratio above 24 — well past the threshold where renting is typically the better financial move.
That said, rent doesn’t build equity. If prices stabilize or rise, today’s buyers recover ground that renters never will. But at current prices and rates, the carrying cost of ownership in Oceanside is steep.
Population Growth and Migration
Oceanside is losing residents. Not quickly — but consistently.
| Year | Population |
|---|---|
| 2020 | 174,071 |
| 2021 | 173,023 |
| 2022 | 171,929 |
| 2023 | 171,069 |
| 2024 | 170,941 |
The city shed 3,130 people between 2020 and 2024, a 1.8% decline. Every single year posted a drop. The pace has slowed — 2024 lost just 128 residents compared to 1,048 in 2021 — but the trend hasn’t reversed.
How does that compare to other California cities?
| City | 2024 Population | 4-Year Growth |
|---|---|---|
| Bakersfield | 417,468 | +3.0% |
| Sacramento | 535,798 | +1.9% |
| San Diego | 1,404,452 | +1.4% |
| Fresno | 550,105 | +1.4% |
| Oakland | 443,554 | +0.6% |
| Oceanside | 170,941 | -1.8% |
Oceanside is the only city on this list losing population. San Diego — 30 miles south — grew by 1.4% over the same period. High housing costs are the likely driver. When your median home costs $885K, the math stops working for a lot of families.
Declining population typically eases housing demand. But Oceanside’s inventory is constrained by geography and zoning, which limits how much population loss can actually move prices.
Oceanside Housing Market Trends
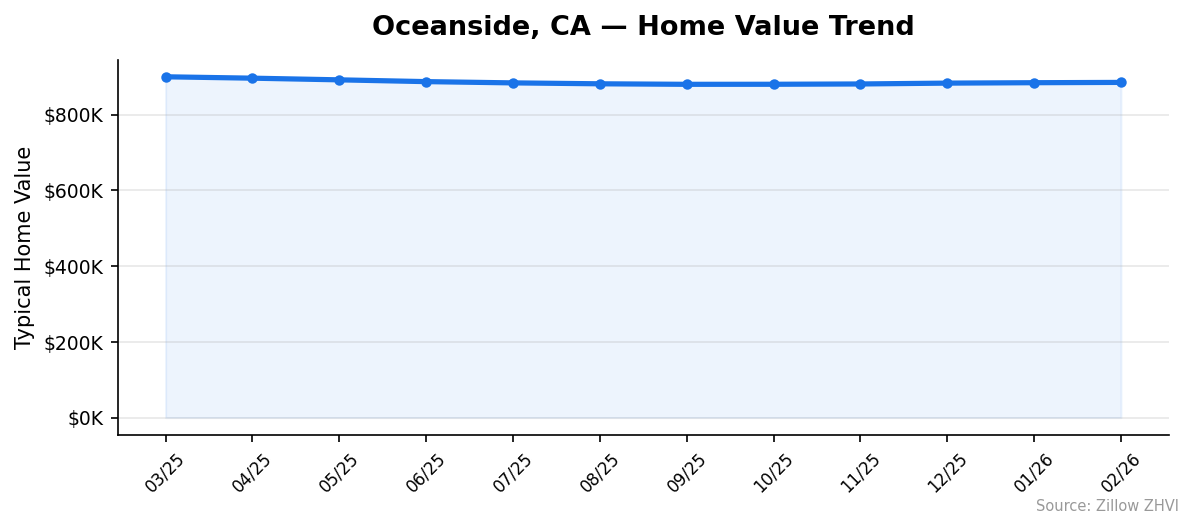
Here’s how the average home value has moved month by month over the past year.
| Month | Average Value | Min ZIP | Max ZIP |
|---|---|---|---|
| Mar 2025 | $899,751 | $787,454 | $1,120,553 |
| Apr 2025 | $896,097 | $783,829 | $1,117,899 |
| May 2025 | $891,678 | $779,631 | $1,113,730 |
| Jun 2025 | $886,991 | $775,218 | $1,108,121 |
| Jul 2025 | $883,660 | $772,127 | $1,104,064 |
| Aug 2025 | $881,244 | $770,521 | $1,100,293 |
| Sep 2025 | $879,870 | $769,823 | $1,098,324 |
| Oct 2025 | $880,002 | $769,630 | $1,098,543 |
| Nov 2025 | $880,795 | $769,552 | $1,099,001 |
| Dec 2025 | $883,034 | $770,688 | $1,100,673 |
| Jan 2026 | $884,119 | $770,844 | $1,101,544 |
| Feb 2026 | $884,920 | $770,445 | $1,103,854 |
The pattern is clear: prices fell from March through September 2025, losing about $20K. Then a modest rebound started in October. The last five months show slow, steady gains — roughly $1,000/month upward.
September 2025 marked the bottom at $879,870. Since then, the market has recovered about $5,000 in value. That’s not a surge. It’s a stabilization.
All four ZIP codes moved in lockstep. The spread between the cheapest and priciest ZIP stayed remarkably consistent throughout the year — around $330K every month.
Is Oceanside a Good Place to Buy in 2026?
The data points in two directions at once.
On the bearish side: prices are still below where they were a year ago, the population is declining, and buying costs far more than renting on a monthly basis. The price-to-rent ratio suggests the market is overvalued relative to local incomes and rent levels.
On the bullish side: the downtrend bottomed out five months ago. The market appears to have found a floor near $880K, and the recent uptick — while modest — shows stability rather than freefall.
For buyers with a long time horizon, the 1.6% annual decline creates negotiating room that didn’t exist two years ago. For investors focused on cash flow, the rent-to-price ratio makes it hard to pencil out at current mortgage rates.
This is a stabilizing market, not a bargain. Prices are high by any national standard, but the worst of the decline appears to be behind us.
Oceanside Housing Market Outlook for 2026-2027
The three-month trend from December 2025 through February 2026 shows prices rising at roughly $950 per month. If that pace continues through mid-2026, the median could push toward $890K by summer.
But that recovery is fragile. The monthly gains are small — less than 0.1% — and the market hasn’t reclaimed its early-2025 peak. To reach $900K again, the current momentum would need to hold for roughly 16 more months.
The most likely scenario: prices hover in the $880K–$895K range through the rest of 2026. A return to $900K is possible but not probable without a meaningful drop in mortgage rates. Any rate increase could send prices back toward the September 2025 low.
Similar Markets in CA
If you’re exploring the broader California market, these cities offer useful comparisons:
- San Diego — The metro anchor, 30 miles south, with a growing population and a much larger inventory.
- Chula Vista — Another San Diego metro city and one of the closer alternatives for Oceanside buyers.
- Anaheim — Orange County option for buyers willing to look north.
- Riverside — Inland Empire pricing that tends to run well below coastal markets.
- Bakersfield — The fastest-growing city on our California comparison list, with far lower home prices.
Frequently Asked Questions
What is the average home price in Oceanside?
The average home price in Oceanside is $884,920 as of February 2026. Across the city’s four tracked ZIP codes, values range from $770,445 in 92058 to $1,103,854 in 92054.
Are home prices going up or down in Oceanside?
Down. Prices fell 1.6% year over year. The decline started in spring 2025 and bottomed out in September at $879,870. Since then, a slow recovery has brought the median back to $884,920 — still below the March 2025 peak of $899,751.
Is it cheaper to rent or buy in Oceanside?
Renting is cheaper in every ZIP code. Typical rents range from $2,675 to $3,144 per month, while estimated mortgage payments on the same homes run $3,860 to $5,530. The monthly gap ranges from about $1,185 to $2,386 depending on the neighborhood.
What is the most affordable neighborhood in Oceanside?
ZIP code 92058 has the lowest median home value at $770,445 and the lowest typical rent at $2,675/month. It sits about $115K below the citywide average, making it the most accessible entry point for buyers.
Methodology
Home values are based on the Zillow Home Value Index (ZHVI), a smoothed measure of typical home values in the 35th to 65th percentile range. Rent estimates use the Zillow Observed Rent Index (ZORI). Population figures come from the U.S. Census Bureau Population Estimates Program (2020-2024 vintage). All datasets are publicly available. Housing data updated 2026-02-28.