Plano Home Prices: $529K, Down 4.1% — 6 ZIPs Analyzed (2026)
$529K. That’s what a typical home costs in Plano right now — and it’s the lowest price the city has seen in over a year.
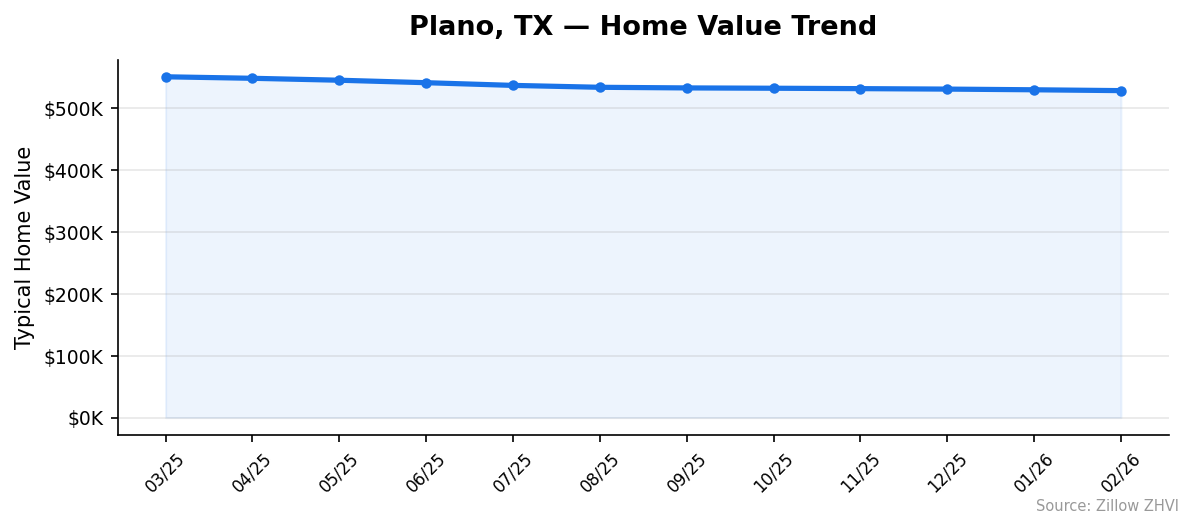
Plano’s housing market has been sliding since spring 2025. The median home value hit $528,861 in February 2026, a 4.1% drop from a year earlier. For a city where prices topped $551K just eleven months ago, the pullback is steady and measurable.
Quick answer: The average home price in Plano, TX is $528,861 as of February 2026, down 4.1% year over year according to Zillow.
Current Home Prices in Plano
Here’s a snapshot of where prices stand right now:
| Metric | Value |
|---|---|
| Median Home Value | $528,861 |
| Year-over-Year Change | -4.1% |
| Lowest ZIP Value | $369,237 |
| Highest ZIP Value | $738,433 |
| Number of ZIPs Tracked | 6 |
| Data As Of | February 2026 |
The $528,861 median means Plano still sits well above the national average, but the direction matters more than the number itself. Prices have dropped every single month in the dataset — from $551,240 in March 2025 to $528,861 in February 2026. That’s a loss of about $22,400 in under a year.
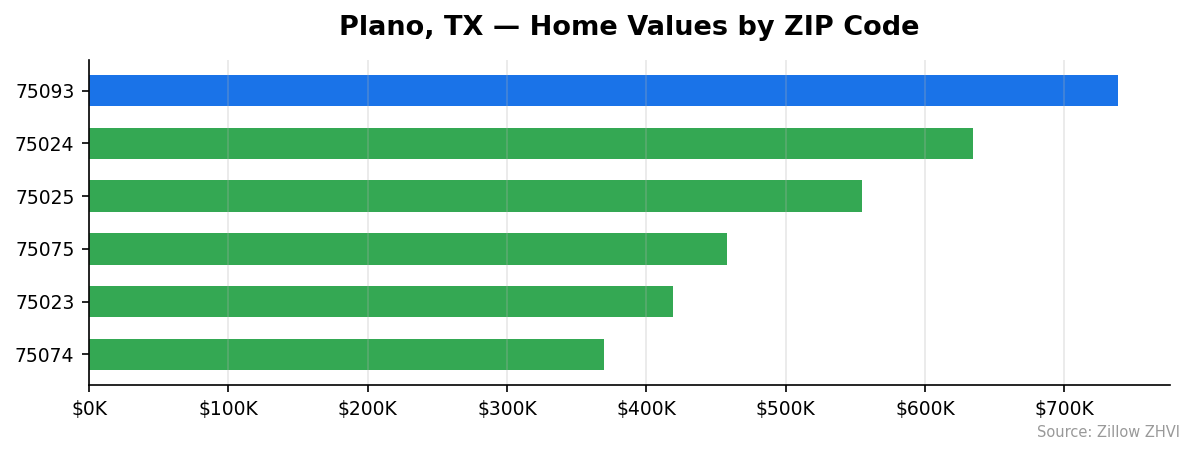
The gap between the cheapest and most expensive ZIP codes in Plano is enormous. A buyer in ZIP 75074 can find a typical home for $369K, while 75093 averages $738K. Same city, double the price. Where you buy within Plano matters as much as whether you buy.
The 4.1% annual decline puts Plano among the softening markets in the Dallas-Fort Worth metro. Sellers who listed at 2025 spring prices are now sitting on homes worth $20K-$30K less.
Plano Home Prices by Neighborhood
All six tracked ZIP codes in Plano, ranked from most to least expensive:
| ZIP Code | Typical Home Value | Typical Monthly Rent |
|---|---|---|
| 75093 | $738,433 | $1,725 |
| 75024 | $634,549 | $1,687 |
| 75025 | $554,415 | $2,079 |
| 75075 | $457,766 | $1,662 |
| 75023 | $418,767 | $1,854 |
| 75074 | $369,237 | $1,631 |
Most Expensive ZIPs
75093 leads at $738,433 — nearly 40% above the city median, yet its rent of $1,725 is not the highest in Plano, making it a market where ownership carries a much bigger premium over renting. 75024 comes in at $634,549, roughly $106K above the city average. 75025 rounds out the top three at $554,415 and has the highest rent in the city at $2,079 per month.
Most Affordable ZIPs
75074 is the entry point into Plano at $369,237 — 30% below the city median and paired with the lowest rent at $1,631. 75023 at $418,767 offers a middle ground, though its rent runs higher at $1,854. 75075 at $457,766 sits just below the city average and carries a modest $1,662 rent.
Rent vs Buy in Plano
The average monthly rent across Plano’s six ZIP codes is approximately $1,773. Here’s how renting compares to buying at the median home price:
| Cost | Monthly Amount |
|---|---|
| Average Rent (ZORI) | $1,773 |
| Mortgage Payment (20% down, 7%) | ~$2,815 |
| Difference | ~$1,042 |
The mortgage figure covers principal and interest only on an $423,089 loan (80% of $528,861 at 7%). Add property taxes, insurance, and maintenance and the true monthly cost of ownership pushes well past $3,500.
That $1,042 monthly gap is real money — over $12,500 a year. For buyers who aren’t building equity fast enough to offset that difference, renting makes financial sense in the short term.
One odd pattern in the data: ZIP 75093 has the highest home values ($738K) but only the fourth-highest rent ($1,725). Meanwhile, 75025 charges the most rent ($2,079) despite being the third most expensive to buy. Rent and sale prices don’t always move together.
Population Growth and Migration
Plano’s population reached 293,286 in 2024, up 2.4% from 286,422 in 2020.
| Year | Population |
|---|---|
| 2020 | 286,422 |
| 2021 | 288,876 |
| 2022 | 291,079 |
| 2023 | 293,413 |
| 2024 | 293,286 |
Growth was steady from 2020 through 2023, adding about 2,300 residents per year. Then it stalled. The 2024 figure actually dipped by 127 people from 2023 — the first decline in the dataset. Plano may be approaching its buildable capacity.
Compared to other Texas cities, Plano’s growth rate is modest:
| City | 2024 Population | 4-Year Growth |
|---|---|---|
| Fort Worth | 1,008,106 | 9.1% |
| San Antonio | 1,526,656 | 6.1% |
| Lubbock | 272,086 | 5.4% |
| Houston | 2,390,125 | 4.0% |
| Austin | 993,588 | 2.9% |
| Plano | 293,286 | 2.4% |
Fort Worth is growing nearly four times faster. Even Austin, which has seen its own price corrections, outpaces Plano on population growth. Slower population growth means less pressure on housing demand — one factor behind falling prices.
Plano Housing Market Trends
The 12-month trend tells a clear story: prices peaked in spring 2025 and have fallen every month since.
| Month | Average Value | Lowest ZIP | Highest ZIP |
|---|---|---|---|
| Mar 2025 | $551,240 | $391,185 | $754,635 |
| Apr 2025 | $548,802 | $388,745 | $753,631 |
| May 2025 | $545,682 | $385,806 | $751,867 |
| Jun 2025 | $541,676 | $382,870 | $747,569 |
| Jul 2025 | $537,324 | $379,796 | $742,066 |
| Aug 2025 | $534,254 | $377,613 | $737,402 |
| Sep 2025 | $533,234 | $376,239 | $735,749 |
| Oct 2025 | $532,718 | $374,755 | $735,843 |
| Nov 2025 | $532,073 | $372,919 | $737,347 |
| Dec 2025 | $531,326 | $371,309 | $739,133 |
| Jan 2026 | $530,222 | $370,069 | $739,614 |
| Feb 2026 | $528,861 | $369,237 | $738,433 |
The decline has two phases. From March to August 2025, prices dropped roughly $3,000 per month. From September 2025 onward, the pace slowed to about $1,000-$1,500 per month. The correction is decelerating but hasn’t stopped.
Both the floor and ceiling are falling. The cheapest ZIP dropped from $391K to $369K. The most expensive fell from $755K to $738K. No price tier is immune.
Is Plano a Good Place to Buy in 2026?
The numbers favor buyers right now. Prices are down 4.1% year over year and still falling. Sellers have less bargaining power than they did a year ago, and inventory has room to grow.
If you’re buying to live in Plano for five or more years, the current market gives you room to negotiate. The $22K decline over eleven months means sellers who’ve been on the market for a while may accept offers below asking.
Short-term buyers face more risk. Prices haven’t bottomed yet based on the monthly trend. Buying today and selling in 18 months could mean taking a loss.
The rent-vs-buy math also matters. At $1,773 average rent versus $3,500+ total ownership cost, renting while waiting isn’t a bad strategy if you’re unsure about timing.
For long-term residents with stable income and a 20% down payment, Plano still offers strong schools, proximity to Dallas, and access to the broader DFW job market. The price correction makes it more accessible than it was a year ago.
Plano Housing Market Outlook for 2026-2027
The 12-month trend points to continued decline, but the pace is slowing. From September 2025 to February 2026, prices dropped about $4,400 — compared to $18,000 during the March-to-August stretch.
If the current pace continues, prices could settle in the $520K-$525K range by mid-2026. The deceleration pattern suggests the market is approaching a floor rather than accelerating downward.
Population growth has stalled, which removes one source of upward price pressure. Without a significant shift in mortgage rates or a surge of new buyers into the DFW metro, a sharp rebound seems unlikely in the near term.
The most probable scenario for late 2026 into 2027: prices flatten near current levels, with small month-to-month moves in either direction. The steep correction phase appears to be winding down.
Similar Markets in TX
If you’re considering Plano, these Texas cities offer different price points:
- Dallas — The neighboring big city in the same metro, often with lower price points depending on the neighborhood.
- Katy — A Houston-area suburb popular with families, worth comparing for those open to relocating within Texas.
- Sugar Land — Another upscale Texas suburb near Houston with a similar demographic profile.
- Grand Prairie — A more affordable option within the DFW metro for buyers priced out of Plano.
- San Antonio — Significantly cheaper than Plano, with faster population growth at 6.1%.
Frequently Asked Questions
What is the average home price in Plano?
The average home price in Plano is $528,861 as of February 2026. This represents the typical home value across all six tracked ZIP codes, with individual neighborhoods ranging from $369,237 in ZIP 75074 to $738,433 in ZIP 75093.
Are home prices going up or down in Plano?
Prices are going down. Plano home values fell 4.1% year over year, dropping from $551,240 in March 2025 to $528,861 in February 2026. The decline has slowed in recent months but hasn’t reversed.
Is it cheaper to rent or buy in Plano?
Renting is cheaper on a monthly basis. The average rent across Plano is about $1,773 per month, while a mortgage on a median-priced home runs approximately $2,815 in principal and interest alone — before taxes, insurance, and maintenance. The gap is roughly $1,042 per month.
What is the most affordable neighborhood in Plano?
ZIP code 75074 is the most affordable area in Plano, with a typical home value of $369,237 — about $160,000 below the city median. It also has the lowest average rent at $1,631 per month. This is the best entry point for budget-conscious buyers looking to stay in Plano.
Methodology
Home values are based on the Zillow Home Value Index (ZHVI), a smoothed measure of typical home values in the 35th to 65th percentile range. Rent estimates use the Zillow Observed Rent Index (ZORI). Population figures come from the U.S. Census Bureau Population Estimates Program (2020-2024 vintage). All datasets are publicly available. Housing data updated 2026-02-28.