Rancho Cordova Home Prices: $523K, Down 2.7% — 3 ZIPs Analyzed (2026)
$523,329. That’s what a typical home costs in Rancho Cordova right now — and it’s headed in the wrong direction for sellers. Prices fell 2.7% over the past year, continuing a slide that started in early 2025. For buyers watching the Sacramento metro, this could be the opening they’ve been waiting for.
Quick answer: The average home price in Rancho Cordova, CA is $523,329 as of February 2026, down 2.7% year over year according to Zillow.
Current Home Prices in Rancho Cordova
| Metric | Value |
|---|---|
| Median Home Price | $523,329 |
| Year-over-Year Change | -2.7% |
| Lowest ZIP Median | $470,341 |
| Highest ZIP Median | $617,842 |
| ZIP Codes Tracked | 3 |
| Data Through | February 2026 |
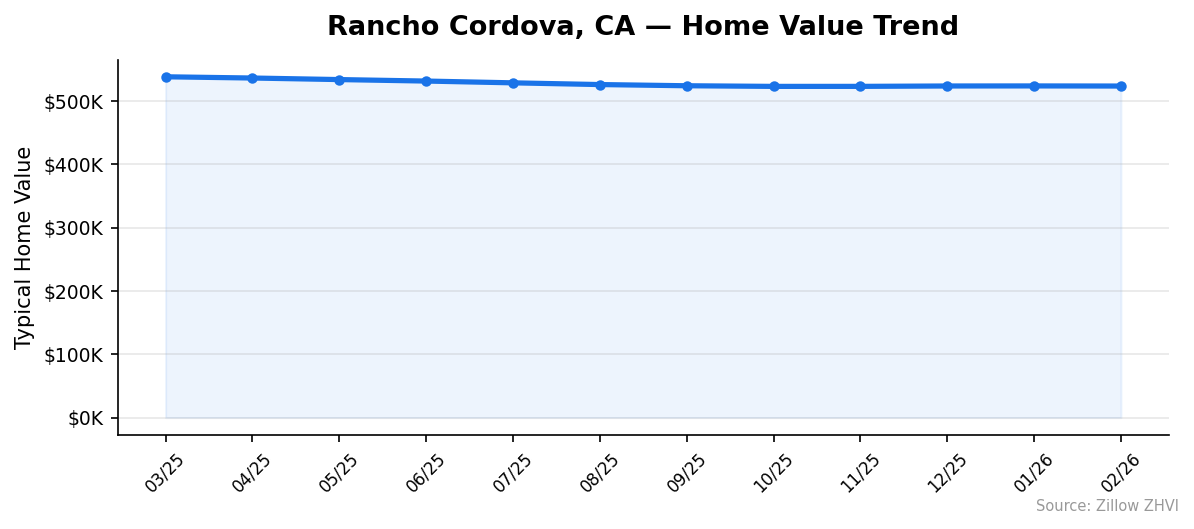
The median sits at $523,329, down from roughly $538,000 a year ago. That’s a loss of about $14,600 in value for the typical homeowner over twelve months.
The spread between the cheapest and most expensive ZIP codes is $147,501. That’s a wide gap for a city of this size. Your experience of the Rancho Cordova market depends heavily on which neighborhood you’re looking in.
Prices peaked around March 2025 at $537,936. Since then, the decline has been gradual — not a crash, but a clear downward drift. Monthly losses have been small, often under $2,000 from one month to the next, but they’ve been consistent.
Rancho Cordova Home Prices by Neighborhood
| ZIP Code | Median Home Price | Median Rent |
|---|---|---|
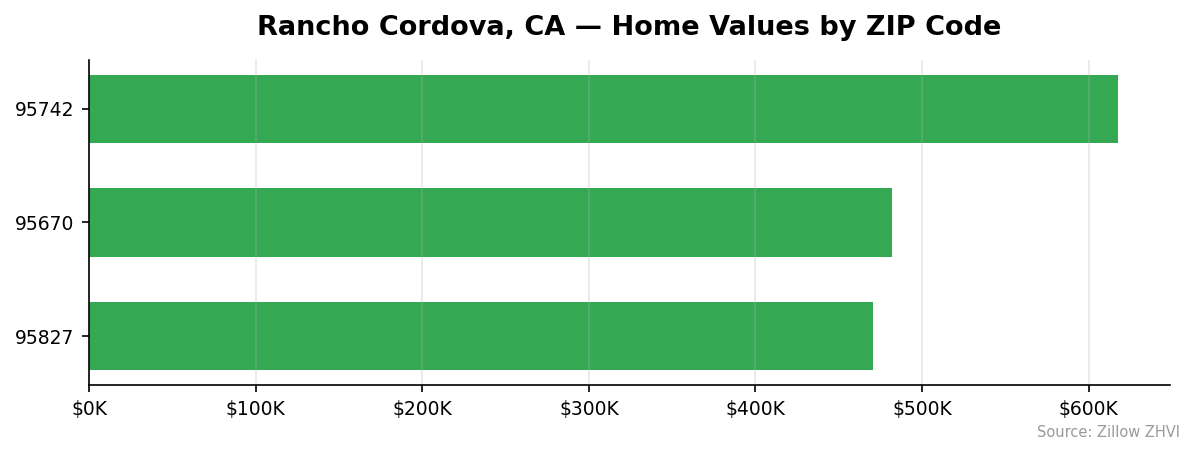
| 95742 | $617,842 | $2,770/mo |
| 95670 | $481,805 | $2,164/mo |
| 95827 | $470,341 | $1,711/mo |
Most Expensive
95742 tops the list at $617,842 — 18% above the city median. Rents here are also the highest at $2,770 per month, reflecting stronger demand and newer housing stock in the eastern part of the city.
Most Affordable
95827 comes in at $470,341, roughly $53,000 below the city average. Rents are the lowest in Rancho Cordova at $1,711 per month. 95670 sits in the middle at $481,805 with rents of $2,164 — a solid option if 95742 is out of budget but you want slightly more than 95827 offers.
The gap between 95742 and 95827 is $147,501. You could buy a home in the cheapest ZIP and still have six figures left over compared to the priciest one.
Rent vs Buy in Rancho Cordova
| ZIP Code | Median Rent | Est. Monthly Mortgage* |
|---|---|---|
| 95670 | $2,164 | ~$2,870 |
| 95827 | $1,711 | ~$2,800 |
| 95742 | $2,770 | ~$3,680 |
Estimated mortgage payment assumes 20% down, 6.8% rate, 30-year fixed. Does not include taxes, insurance, or HOA.
Renting is cheaper across the board. In 95827, the gap is roughly $1,100 per month. Even in 95742 where rents run highest, you’d save about $900 monthly by renting instead of buying.
That doesn’t mean buying is always the wrong call. If prices stabilize and you plan to stay five-plus years, the equity math starts to shift. But right now, with prices still declining, renters aren’t missing out on appreciation.
The rent-to-price ratio tells the story. In 95827, $1,711 in rent on a $470,341 home works out to about 4.4% annually. That’s below the 5% threshold where buying typically starts to make financial sense on a cash-flow basis.
Population Growth and Migration
Rancho Cordova’s population hit 84,113 in 2024, up 5.6% from 79,631 in 2020. That’s roughly 4,482 new residents in four years.
| Year | Population |
|---|---|
| 2020 | 79,631 |
| 2021 | 80,811 |
| 2022 | 81,846 |
| 2023 | 82,835 |
| 2024 | 84,113 |
Growth has been steady — about 1,100 people per year with slight acceleration in 2024. The city is adding residents faster than most of its larger neighbors.
| City | 2024 Population | 4-Year Growth |
|---|---|---|
| Rancho Cordova | 84,113 | 5.6% |
| Bakersfield | 417,468 | 3.0% |
| Sacramento | 535,798 | 1.9% |
| San Diego | 1,404,452 | 1.4% |
| Fresno | 550,105 | 1.4% |
| Oakland | 443,554 | 0.6% |
Rancho Cordova’s 5.6% growth rate nearly doubles Bakersfield’s and triples Sacramento’s. For a city in the Sacramento metro, that’s notable. People are choosing Rancho Cordova over the capital itself.
More residents usually means more housing demand. Yet prices are falling. That suggests supply is keeping up — or that affordability constraints are capping what buyers can pay, even as the population grows.
Rancho Cordova Housing Market Trends
| Month | Average Price | Lowest ZIP | Highest ZIP |
|---|---|---|---|
| Feb 2026 | $523,329 | $470,341 | $617,842 |
| Jan 2026 | $523,504 | $470,045 | $618,468 |
| Dec 2025 | $523,414 | $469,352 | $618,928 |
| Nov 2025 | $522,817 | $467,671 | $619,573 |
| Oct 2025 | $522,787 | $466,530 | $620,870 |
| Sep 2025 | $523,783 | $466,771 | $623,047 |
| Aug 2025 | $525,671 | $468,001 | $626,246 |
| Jul 2025 | $528,380 | $470,223 | $630,199 |
| Jun 2025 | $531,195 | $472,611 | $634,214 |
| May 2025 | $533,534 | $474,729 | $637,303 |
| Apr 2025 | $535,988 | $476,937 | $640,389 |
| Mar 2025 | $537,936 | $478,998 | $642,261 |
The pattern is unmistakable. Prices peaked in March 2025 at $537,936 and have declined every month since. The total drop over twelve months: $14,607, or 2.7%.
Something interesting is happening at the ZIP level. The most expensive area (95742) dropped from $642,261 to $617,842 — a $24,419 loss. The cheapest ZIP (95827) fell only $8,657 over the same period. Higher-priced neighborhoods are giving back more.
The decline has slowed recently. The average dropped just $175 between January and February, compared to $2,700 monthly drops in the summer. That flattening could signal a bottom — or just a winter pause before seasonal patterns kick in.
Is Rancho Cordova a Good Place to Buy in 2026?
The numbers paint a mixed picture. On the plus side: prices have come down $14,600 from their peak, the decline is decelerating, and population growth remains strong at 5.6% over four years. Demand isn’t disappearing.
On the other hand, renting is significantly cheaper than buying in every ZIP code. Prices are still sliding, even if slowly. Buying now means accepting that your home might lose another 1-2% before stabilizing.
For buyers with a long time horizon — five years or more — Rancho Cordova offers an entry point below the 2025 peak. ZIP 95827 at $470,341 is the most accessible option and carries the lowest rent, which limits your downside if you need to convert to a rental later.
If you’re on a tight budget or plan to move within three years, renting makes more financial sense right now.
Rancho Cordova Housing Market Outlook for 2026-2027
The three-month trend from December 2025 through February 2026 shows near-flat movement. Prices barely budged — the average shifted less than $200 over that stretch. Compare that to the $2,000-$3,000 monthly drops in mid-2025, and the deceleration is clear.
If the current pace continues, prices could stabilize in: the $520,000-$525,000 range by mid-2026. The steep declines appear to be over. Spring and summer typically bring more buyer activity, which could halt the slide or even produce a small bounce.
The affordable end of the market (95827) has already started firming up — its values have been climbing slightly since October 2025 while the premium ZIP (95742) keeps falling. That compression suggests the floor may be closer than the average number implies.
Similar Markets in CA
If you’re shopping in Rancho Cordova, these California cities are worth comparing:
- Bakersfield — A much cheaper market south in the Central Valley, with 3.0% population growth and lower price points.
- Fresno — Another Central Valley option with a large population base and more affordable housing than the Sacramento metro.
- Fontana — Inland Empire city east of Los Angeles that attracts buyers priced out of coastal markets.
- Riverside — Similar commuter-city profile with a mix of price ranges across its ZIP codes.
- Long Beach — More expensive but offers proximity to LA and the coast if budget allows a step up.
Frequently Asked Questions
What is the average home price in Rancho Cordova?
The average home price in Rancho Cordova is $523,329 as of February 2026. Prices range from $470,341 in ZIP 95827 to $617,842 in ZIP 95742. The city-wide median has declined 2.7% over the past year.
Are home prices going up or down in Rancho Cordova?
Prices are going down. The median fell 2.7% year over year, dropping from roughly $538,000 in early 2025 to $523,329 in February 2026. However, the monthly rate of decline has slowed significantly in recent months.
Is it cheaper to rent or buy in Rancho Cordova?
Renting is cheaper in all three ZIP codes. Median rents range from $1,711 to $2,770 per month. Estimated mortgage payments on the same homes would run $2,800 to $3,680 — a gap of $700 to $1,100 per month, even with 20% down.
What is the most affordable neighborhood in Rancho Cordova?
ZIP code 95827 is the most affordable at $470,341, with average rents of $1,711 per month. That’s roughly $53,000 below the city-wide median and $147,500 less than the priciest ZIP code, 95742.
Is Rancho Cordova growing or shrinking?
Rancho Cordova is growing. Population increased 5.6% from 2020 to 2024, reaching 84,113 residents. That growth rate outpaces Sacramento (1.9%), Fresno (1.4%), and Oakland (0.6%).
Methodology
Home values are based on the Zillow Home Value Index (ZHVI), a smoothed measure of typical home values in the 35th to 65th percentile range. Rent estimates use the Zillow Observed Rent Index (ZORI). Population figures come from the U.S. Census Bureau Population Estimates Program (2020-2024 vintage). All datasets are publicly available. Housing data updated 2026-02-28.