Round Rock Home Prices: $410K, Down 5.1% — 3 ZIPs Analyzed (2026)
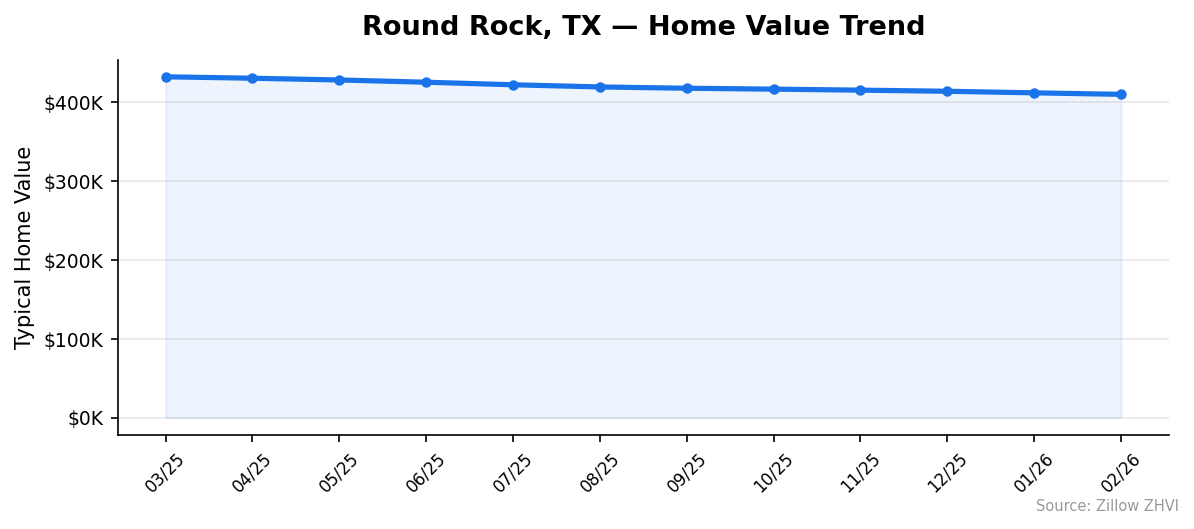
Prices dropped for the 12th straight month. The median home in Round Rock, TX now sits at $410,315 — down 5.1% from a year ago. That’s a loss of roughly $22,000 in equity for the typical homeowner.
Quick answer: The average home price in Round Rock, TX is $410,315 as of February 2026, down 5.1% year over year according to Zillow.
Current Home Prices in Round Rock
| Metric | Value |
|---|---|
| Median Home Value | $410,315 |
| Year-over-Year Change | -5.1% |
| Lowest ZIP Median | $341,591 |
| Highest ZIP Median | $484,860 |
| Number of ZIPs Tracked | 3 |
| Data As Of | February 2026 |
Round Rock sits in the Austin-Round Rock-Georgetown metro, and it’s feeling the same correction that has hit the broader Austin area. The median peaked near $505K in early 2025 and has dropped steadily since.
That 5.1% decline translates to about $1,900 per month in lost value over the past year. If you bought at the peak, your home is worth roughly $95K less today.
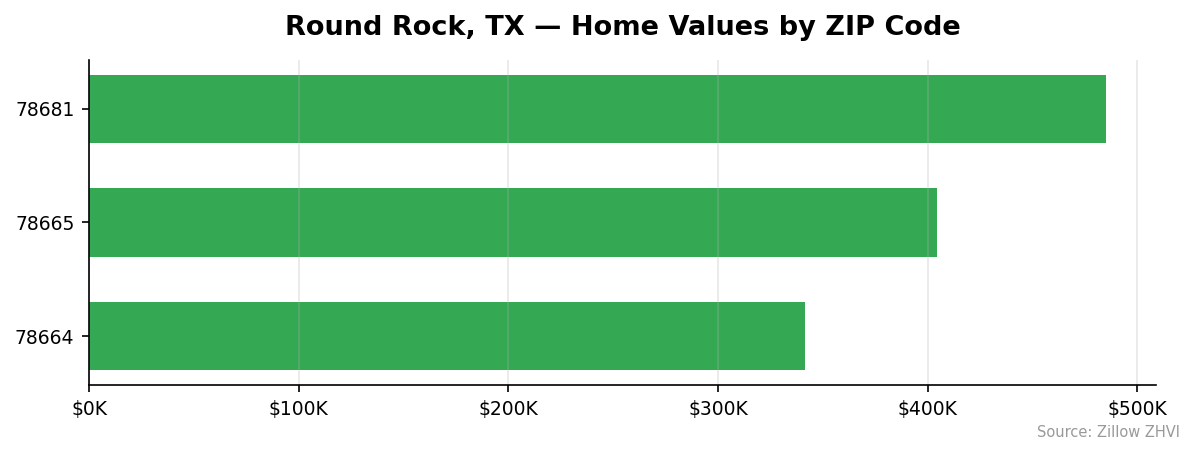
The price range across Round Rock’s three tracked ZIP codes is wide — $143,000 separates the cheapest neighborhood from the most expensive. That gap matters if you’re shopping on a budget.
Round Rock Home Prices by Neighborhood
| ZIP Code | Median Home Value | Avg. Monthly Rent |
|---|---|---|
| 78664 | $341,591 | $1,578 |
| 78665 | $404,495 | $1,551 |
| 78681 | $484,860 | $1,611 |
Most Expensive
78681 tops the list at $484,860 — about 18% above the city median, with rents to match at $1,611/month.
Most Affordable
78664 comes in at $341,591, roughly $69,000 below the city average. Rent here is $1,578/month — only $33 less than the priciest ZIP. That tight rent spread across a wide price gap makes 78664 stand out for renters considering a purchase.
78665 sits in the middle at $404,495 and actually has the lowest rent of the three at $1,551/month.
Rent vs Buy in Round Rock
Average rent across Round Rock’s three ZIP codes runs about $1,580/month.
| ZIP Code | Monthly Rent | Home Value | Price-to-Rent Ratio |
|---|---|---|---|
| 78664 | $1,578 | $341,591 | 18.0 |
| 78665 | $1,551 | $404,495 | 21.7 |
| 78681 | $1,611 | $484,860 | 25.1 |
A mortgage on the city-wide median of $410,315 with 20% down ($82,063) at a 6.5% rate would cost roughly $2,075/month in principal and interest alone. Add property taxes and insurance, and you’re looking at $2,600-$2,800/month.
That’s $1,000+ more than renting.
The price-to-rent ratio tells the story. In 78664, it’s 18.0 — on the edge of where buying starts to make financial sense. In 78681, it’s 25.1 — firmly in renter-friendly territory by most financial guidelines.
With prices still falling, waiting has been the winning strategy. Every month of decline makes the buy math slightly better.
Population Growth and Migration
Round Rock is one of the fastest-growing cities in Texas. The population hit 135,359 in 2024, up 12.3% from 120,572 in 2020.
| Year | Population |
|---|---|
| 2020 | 120,572 |
| 2021 | 124,146 |
| 2022 | 127,269 |
| 2023 | 131,316 |
| 2024 | 135,359 |
That’s roughly 3,700 new residents per year — steady, consistent growth without the wild spikes that can destabilize a market.
How Round Rock Compares
| City | 2024 Population | 4-Year Growth |
|---|---|---|
| Round Rock | 135,359 | 12.3% |
| Fort Worth | 1,008,106 | 9.1% |
| San Antonio | 1,526,656 | 6.1% |
| Lubbock | 272,086 | 5.4% |
| Houston | 2,390,125 | 4.0% |
| Austin | 993,588 | 2.9% |
Round Rock’s growth rate is more than four times Austin’s. People are moving to the metro — they’re just choosing Round Rock over the city center.
This population pressure creates a floor under housing demand. Prices are falling because of the broader Austin correction, not because people are leaving.
Round Rock Housing Market Trends
| Month | Median Value | Change from Prior Month |
|---|---|---|
| Feb 2026 | $410,315 | -$1,895 |
| Jan 2026 | $412,210 | -$2,002 |
| Dec 2025 | $414,212 | -$1,419 |
| Nov 2025 | $415,631 | -$1,271 |
| Oct 2025 | $416,902 | -$1,171 |
| Sep 2025 | $418,073 | -$1,632 |
| Aug 2025 | $419,705 | -$2,756 |
| Jul 2025 | $422,461 | -$3,236 |
| Jun 2025 | $425,697 | -$2,851 |
| May 2025 | $428,548 | -$2,224 |
| Apr 2025 | $430,772 | -$1,820 |
| Mar 2025 | $432,592 | — |
Twelve consecutive months of decline. Not a single up month in the data.
The pace of decline has been uneven. Summer 2025 saw the steepest drops — $2,800 to $3,200 per month — likely as overpriced listings from spring met buyer resistance. The fall months slowed to around $1,200-$1,600/month of decline.
January and February 2026 picked up again, each losing about $2,000. Total decline from March 2025 to February 2026: $22,277, or 5.2%.
Is Round Rock a Good Place to Buy in 2026?
The numbers point to a buyer’s market. Twelve straight months of falling prices give buyers the upper hand at the negotiating table.
Round Rock has a few things working in its favor for long-term buyers. Population growth of 12.3% over four years means demand isn’t disappearing. The price correction is bringing values closer to what incomes can support. And the spread between the cheapest and most expensive ZIPs — $143K — means you have options at different price points.
The risk: prices are still falling, and there’s no clear sign of a bottom yet. If you buy today at $410K and the decline continues at the current pace, you could be underwater by $10-15K within six months.
For buyers with a 5+ year timeline, current prices represent better value than anything available in 2024. For short-term holds, the math is risky.
Round Rock Housing Market Outlook for 2026-2027
The 3-month trend from December 2025 through February 2026 shows losses of $1,400-$2,000 per month. That’s a modest acceleration from the fall.
If the current pace continues, the median could dip below $400K by mid-2026. The last time Round Rock was below $400K would represent a full round-trip from the pandemic-era gains.
Spring and summer typically bring more buyers into the market. That seasonal demand could slow the slide but is unlikely to reverse it given the broader Austin metro correction.
The population growth rate — adding 3,700+ residents annually — puts a floor under demand. A stabilization somewhere in the $380K-$400K range over the next 12 months wouldn’t be surprising, but this depends on mortgage rates and Austin metro job growth.
Similar Markets in TX
If you’re considering Round Rock, these other Texas markets are worth a look:
- Houston — The state’s largest city offers a wide range of price points and has grown 4.0% since 2020.
- San Antonio — Significantly more affordable than the Austin metro, with steady 6.1% population growth.
- Dallas — Another major metro with a deep job market for buyers priced out of Austin.
- Katy — A suburb west of Houston that attracts a similar family-oriented buyer as Round Rock.
- Sugar Land — Another Houston-area suburb worth comparing for suburban buyers weighing Austin vs Houston metros.
Frequently Asked Questions
What is the average home price in Round Rock?
The median home value in Round Rock is $410,315 as of February 2026. Prices range from $341,591 in ZIP 78664 to $484,860 in ZIP 78681. The city-wide median has fallen $22,277 over the past 12 months.
Are home prices going up or down in Round Rock?
Down. Prices have declined every single month for the past 12 months, totaling a 5.1% year-over-year drop. The steepest monthly declines came in summer 2025, with losses exceeding $3,000/month in July. The decline has continued into early 2026 at roughly $2,000/month.
Is it cheaper to rent or buy in Round Rock?
Renting is cheaper right now. Average rent is about $1,580/month. A mortgage on the median-priced home with 20% down at 6.5% would run roughly $2,075/month in principal and interest — before property taxes and insurance push total costs to $2,600-$2,800. You’d pay $1,000+ more per month to own.
What is the most affordable neighborhood in Round Rock?
ZIP code 78664 has the lowest median home value at $341,591 — about 17% below the city average. Rent there is $1,578/month. It offers the best price-to-rent ratio in the city at 18.0, making it the strongest candidate for buyers who want their monthly costs close to what they’d pay as renters.
Methodology
Home values are based on the Zillow Home Value Index (ZHVI), a smoothed measure of typical home values in the 35th to 65th percentile range. Rent estimates use the Zillow Observed Rent Index (ZORI). Population figures come from the U.S. Census Bureau Population Estimates Program (2020-2024 vintage). All datasets are publicly available. Housing data updated 2026-02-28.