Santa Clara Home Prices: $1,688K, Down 1% — 3 ZIPs Analyzed (2026)
$1,688,232. That’s the price of a typical home in Santa Clara, California — down 0.9% from a year ago. The slight dip barely registers in a market where the entry point is north of $1.5 million.
Quick answer: The average home price in Santa Clara, CA is $1,688,232 as of February 2026, down 0.9% year over year according to Zillow.
Current Home Prices in Santa Clara
The Santa Clara housing market sits in the San Jose-Sunnyvale-Santa Clara metro, one of the priciest in the country. Here’s the snapshot:
| Metric | Value |
|---|---|
| Median home price | $1,688,232 |
| Year-over-year change | -0.9% |
| Lowest ZIP price | $1,526,123 |
| Highest ZIP price | $1,905,587 |
| Price spread | $379,464 |
| Number of ZIPs tracked | 3 |
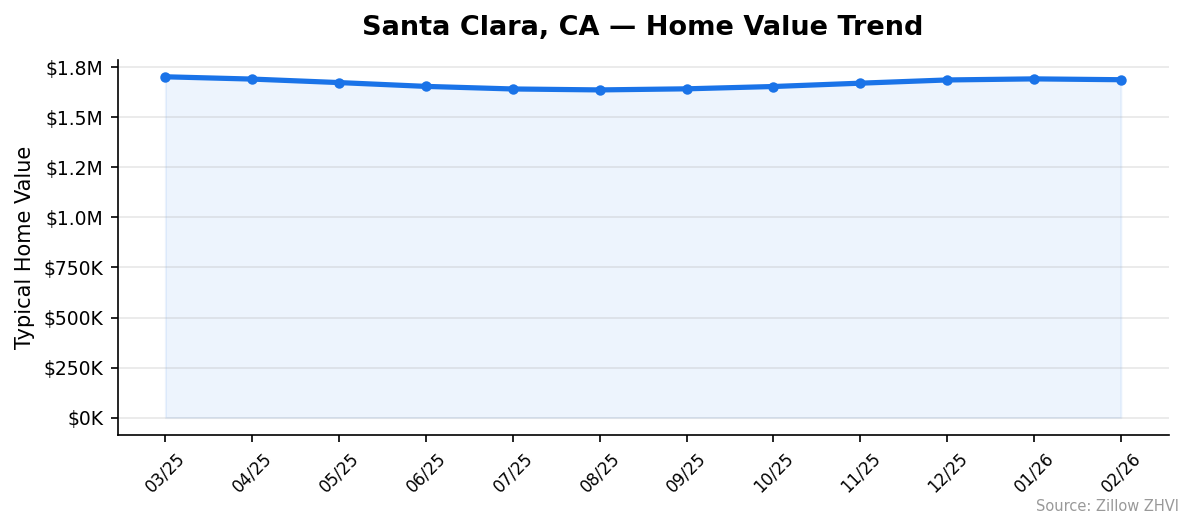
That 0.9% decline translates to roughly $15,000 in lost value over 12 months. For a market at this price level, that’s noise — not a correction.
A year ago, the median sat around $1,703,000. The drop has been slow and uneven. Prices actually climbed from August through January before ticking down again in February. The market isn’t falling apart. It’s flattening.
The $379,464 gap between the cheapest and most expensive ZIP codes means your neighborhood choice matters. At these price levels, picking the right ZIP code can save you hundreds of thousands.
Santa Clara Home Prices by Neighborhood
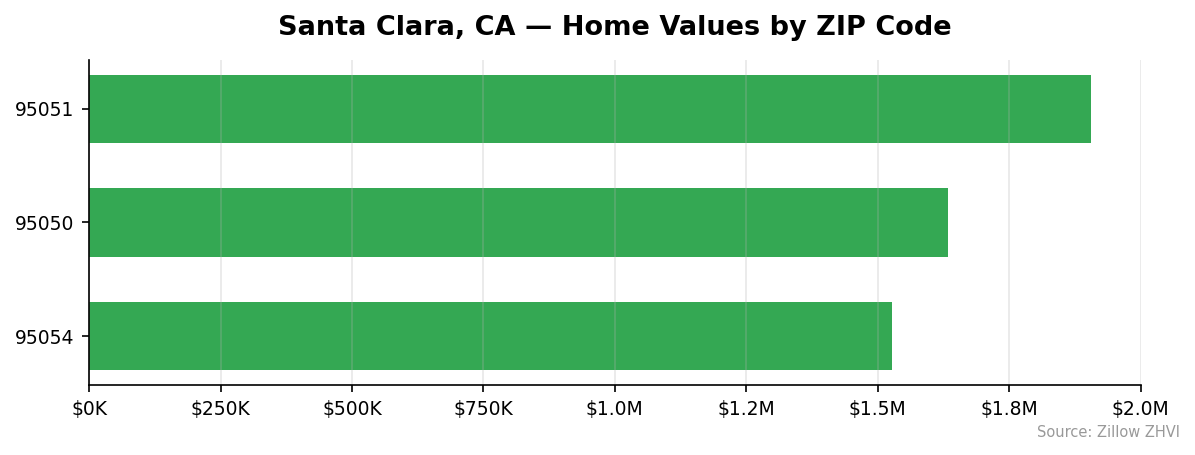
All three Santa Clara ZIP codes carry seven-figure price tags. Here’s how they compare:
| ZIP Code | Median Home Price | Median Rent | Price vs. City Average |
|---|---|---|---|
| 95051 | $1,905,587 | $3,519/mo | +12.9% |
| 95050 | $1,632,987 | $3,459/mo | -3.3% |
| 95054 | $1,526,123 | $4,029/mo | -9.6% |
Most Expensive
95051 tops the list at $1,905,587 — nearly 13% above the city average. Despite carrying the highest home prices, it has mid-range rents at $3,519 per month, suggesting more owner-occupied households.
Most Affordable
95054 comes in at $1,526,123, roughly $162,000 below the citywide median. Interestingly, 95054 has the highest rents of any Santa Clara ZIP at $4,029 per month. That disconnect between lower purchase prices and higher rents could signal strong rental demand from workers who haven’t bought yet.
95050 sits in the middle at $1,632,987 with the lowest rents in the city at $3,459 per month.
Rent vs Buy in Santa Clara
Renting wins the math by a wide margin.
The average rent across Santa Clara’s three ZIP codes comes to about $3,669 per month. Now compare that to buying.
On a $1,688,232 home with 20% down ($337,647), you’d finance $1,350,585. At a 7% mortgage rate over 30 years, your principal and interest alone runs roughly $8,985 per month. Add property taxes at California’s roughly 1.1% rate ($1,548/month) and homeowner’s insurance ($200/month), and you’re looking at about $10,733 per month.
| Monthly Cost | Amount |
|---|---|
| Rent (city average) | $3,669 |
| Mortgage (P&I) | $8,985 |
| Property taxes | $1,548 |
| Insurance (est.) | $200 |
| Total ownership cost | $10,733 |
That’s a $7,064 monthly gap between renting and buying. Owning costs nearly three times what renting does.
The case for buying here relies entirely on long-term appreciation. If prices grow 3-5% annually, the equity gains could justify the premium. But with prices flat to slightly down right now, renters are keeping more cash in their pockets.
Population Growth and Migration
Santa Clara is adding residents. The city grew from 128,606 people in 2020 to 133,132 in 2024 — a 3.5% increase over four years.
| Year | Population | Change |
|---|---|---|
| 2020 | 128,606 | — |
| 2021 | 128,498 | -108 |
| 2022 | 129,632 | +1,134 |
| 2023 | 131,488 | +1,856 |
| 2024 | 133,132 | +1,644 |
The city dipped slightly in 2021 — likely pandemic-related — then rebounded with accelerating gains through 2023. Growth moderated slightly in 2024 but remained solid.
How does Santa Clara stack up against other California cities?
| City | 2024 Population | 4-Year Growth |
|---|---|---|
| Santa Clara | 133,132 | 3.5% |
| Bakersfield | 417,468 | 3.0% |
| Sacramento | 535,798 | 1.9% |
| San Diego | 1,404,452 | 1.4% |
| Fresno | 550,105 | 1.4% |
| Oakland | 443,554 | 0.6% |
Santa Clara leads this group in growth rate despite being the smallest city on the list. That 3.5% outpaces even Bakersfield, which has been one of California’s fastest-growing large cities. More people means more housing demand, which helps explain why prices stay elevated even when the broader market softens.
Santa Clara Housing Market Trends
Here’s how the median home price moved month by month over the past year:
| Month | Median Price | Monthly Change |
|---|---|---|
| Mar 2025 | $1,702,881 | — |
| Apr 2025 | $1,691,417 | -$11,464 |
| May 2025 | $1,673,930 | -$17,487 |
| Jun 2025 | $1,654,897 | -$19,033 |
| Jul 2025 | $1,642,007 | -$12,890 |
| Aug 2025 | $1,637,317 | -$4,690 |
| Sep 2025 | $1,642,743 | +$5,426 |
| Oct 2025 | $1,654,298 | +$11,555 |
| Nov 2025 | $1,670,923 | +$16,625 |
| Dec 2025 | $1,687,048 | +$16,125 |
| Jan 2026 | $1,692,423 | +$5,375 |
| Feb 2026 | $1,688,232 | -$4,191 |
The pattern is clear. Prices fell from March through August 2025, bottoming at $1,637,317. Then they climbed for five straight months before pulling back slightly in February.
That August low to January high represents a $55,106 swing — a 3.4% gain in five months. February’s small dip could be seasonal or the start of another correction. One month isn’t enough to call it a trend.
Is Santa Clara a Good Place to Buy in 2026?
The data paints a flat market. Prices are essentially where they were a year ago, down less than 1%.
For buyers, that’s mixed news. You’re not overpaying in a frenzy, but you’re also not getting a deal. The $1.69 million median puts Santa Clara firmly in premium territory. You need a household income north of $350,000 to comfortably afford the median home here.
The rental math favors waiting if you don’t have strong roots. At $3,669 per month versus $10,733 to own, you’d need prices to appreciate about 5% annually just to break even against renting and investing the difference.
But if you’re already in the area with a tech salary and plan to stay 7-10 years, the calculus shifts. Santa Clara’s population growth and proximity to major employers provide a floor that many markets lack. The market isn’t offering discounts, but it’s also not punishing you with rapid appreciation you’d miss by waiting.
Santa Clara Housing Market Outlook for 2026-2027
The six-month trend from August 2025 through January 2026 was clearly upward, gaining about $55,000 in median value. February’s small pullback of $4,191 doesn’t erase that momentum.
If the current pace continues, prices will likely hover in the $1,670,000 to $1,710,000 range through mid-2026. The seasonal pattern in the data suggests a potential dip through summer followed by a fall recovery — mirroring what happened in 2025.
The year-over-year decline has been narrowing. March 2025 hit $1,702,881, so if prices hold near current levels, the annual comparison could flip positive by spring. Don’t expect large moves in either direction. This market has been trading in a $65,000 band for a year, and nothing in the data suggests a breakout.
Similar Markets in CA
If you’re looking at Santa Clara, these California markets are worth comparing:
- Los Angeles — A much larger market with a wider price range and more entry-level options than Santa Clara.
- San Diego — Coastal California prices without Silicon Valley’s premium, and 1.4% population growth.
- Bakersfield — California’s affordable alternative with 3.0% population growth, the closest to Santa Clara’s rate.
- Fresno — Central Valley pricing well below the Bay Area, attracting remote workers priced out of coastal cities.
- Anaheim — Southern California option in Orange County with a different job market but similar state-level dynamics.
Frequently Asked Questions
What is the average home price in Santa Clara?
The average home price in Santa Clara is $1,688,232 as of February 2026. Across the city’s three tracked ZIP codes, prices range from $1,526,123 in 95054 to $1,905,587 in 95051.
Are home prices going up or down in Santa Clara?
Prices are down 0.9% compared to a year ago. They bottomed in August 2025 at $1,637,317 and recovered through January 2026 before ticking down slightly in February. The market is essentially flat year over year.
Is it cheaper to rent or buy in Santa Clara?
Renting is significantly cheaper. The average monthly rent is about $3,669, while total monthly ownership costs on the median home run approximately $10,733. That’s a gap of over $7,000 per month, making Santa Clara one of the most lopsided rent-vs-buy markets in the state.
What is the most affordable neighborhood in Santa Clara?
ZIP code 95054 is the most affordable at $1,526,123, which is $162,109 below the city median. Despite lower home prices, 95054 carries the highest rents in the city at $4,029 per month, suggesting strong rental demand in the area.
Methodology
Home values are based on the Zillow Home Value Index (ZHVI), a smoothed measure of typical home values in the 35th to 65th percentile range. Rent estimates use the Zillow Observed Rent Index (ZORI). Population figures come from the U.S. Census Bureau Population Estimates Program (2020-2024 vintage). All datasets are publicly available. Housing data updated 2026-02-28.