Santa Maria Home Prices: $638K, Up 1.1% — 3 ZIPs Analyzed (2026)
$638,447. That’s what a typical home costs in Santa Maria right now. Prices are up 1.1% from a year ago — modest growth, but growth all the same in a California market where six-figure price tags are the norm. Across the city’s three tracked ZIP codes, values range from just under $600K to just over $700K.
Quick answer: The average home price in Santa Maria, CA is $638,447 as of February 2026, up 1.1% year over year according to Zillow.
Current Home Prices in Santa Maria
| Metric | Value |
|---|---|
| Median Home Value | $638,447 |
| Year-over-Year Change | +1.1% |
| Lowest ZIP Value | $596,503 |
| Highest ZIP Value | $702,181 |
| Number of ZIPs Tracked | 3 |
| Data as of | February 2026 |
A 1.1% annual gain translates to roughly $7,000 in added value over the past 12 months. That puts Santa Maria in slow-growth territory — not stagnant, but not overheating either.
The gap between the cheapest and most expensive ZIP is about $106,000. For a city with only three tracked neighborhoods, that’s a meaningful spread. Where you buy within Santa Maria matters.
If you purchased at the city median a year ago, your home gained roughly $58 per day in value. Not life-changing, but it kept pace with inflation.
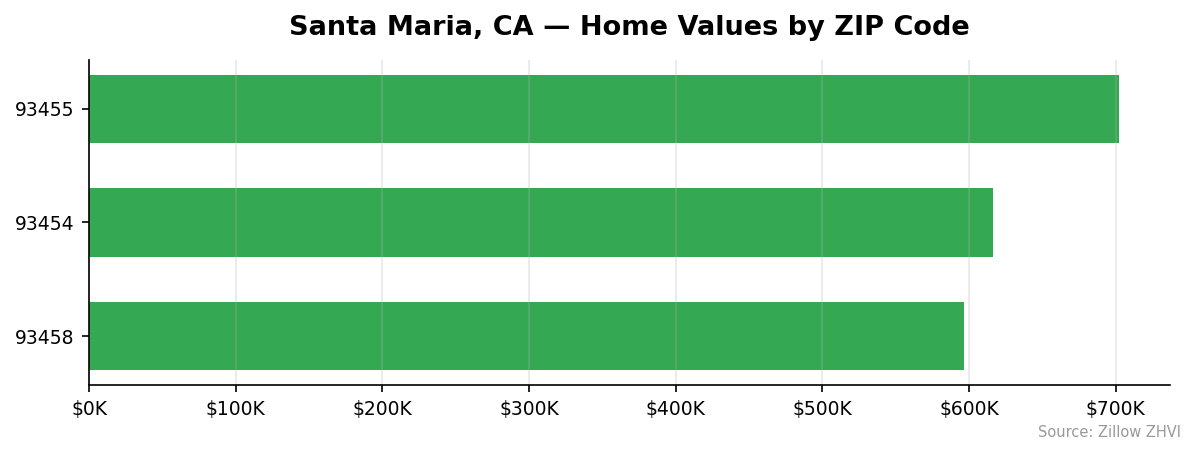
Santa Maria Home Prices by Neighborhood
| ZIP Code | Median Home Value | Median Rent |
|---|---|---|
| 93455 | $702,181 | $2,978/mo |
| 93454 | $616,659 | $2,381/mo |
| 93458 | $596,503 | $1,945/mo |
Most Expensive
93455 tops the list at $702,181 — about 10% above the city median — with rents to match at $2,978 per month.
Most Affordable
93458 comes in at $596,503, roughly 6.6% below the city average, making it the only Santa Maria ZIP under $600K. Rent here is also the lowest at $1,945 per month.
93454 sits in the middle at $616,659 with $2,381 in monthly rent — a reasonable split between the city’s two extremes.
Rent vs Buy in Santa Maria
The rent-or-buy math in Santa Maria leans toward renting — at least on paper.
| ZIP | Monthly Rent | Est. Mortgage (6.5%, 20% down) | Difference |
|---|---|---|---|
| 93458 | $1,945 | ~$3,016 | +$1,071/mo to buy |
| 93454 | $2,381 | ~$3,118 | +$737/mo to buy |
| 93455 | $2,978 | ~$3,551 | +$573/mo to buy |
These mortgage estimates assume a 20% down payment at 6.5% on a 30-year fixed loan. They don’t include property taxes, insurance, or maintenance — which in California can add $500-$800 per month.
Buying costs more every month in every ZIP code. The cheapest ZIP (93458) has the biggest gap: $1,071 extra per month to own versus rent. In 93455, the gap narrows because rents are already high.
If you plan to stay five years or more, buying builds equity. But the monthly premium is real. A buyer in 93458 would pay roughly $12,852 more per year than a renter for the same area.
Population Growth and Migration
Santa Maria’s population hit 111,346 in 2024. That’s a 1.4% gain from 109,782 in 2020 — slow but steady growth.
| Year | Population |
|---|---|
| 2020 | 109,782 |
| 2021 | 110,072 |
| 2022 | 110,385 |
| 2023 | 110,641 |
| 2024 | 111,346 |
The city added about 1,564 residents over four years. Growth accelerated slightly in 2024, with a jump of 705 people — the largest single-year gain in the period.
How does Santa Maria compare to other California cities?
| City | 2024 Population | 4-Year Growth |
|---|---|---|
| Bakersfield | 417,468 | 3.0% |
| Sacramento | 535,798 | 1.9% |
| San Diego | 1,404,452 | 1.4% |
| Fresno | 550,105 | 1.4% |
| Santa Maria | 111,346 | 1.4% |
| Oakland | 443,554 | 0.6% |
Santa Maria’s 1.4% growth matches San Diego and Fresno. It trails Bakersfield and Sacramento but outpaces Oakland. For a city its size, holding steady population is a positive sign for housing demand — more people means more competition for a limited housing stock.
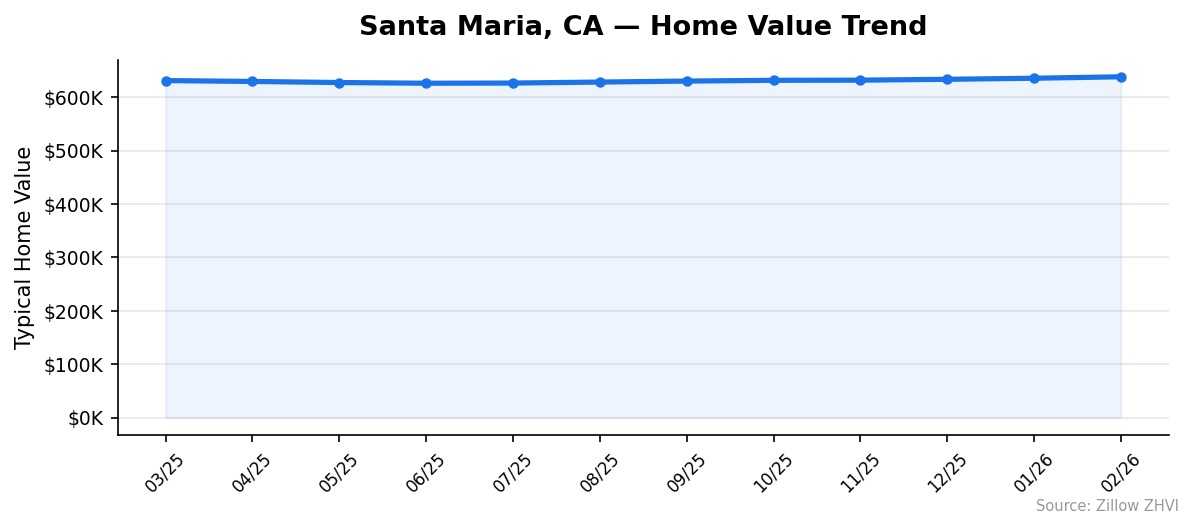
Santa Maria Housing Market Trends
| Month | Avg Value | Low (93458) | High (93455) |
|---|---|---|---|
| Feb 2026 | $638,447 | $596,503 | $702,181 |
| Jan 2026 | $635,734 | $594,175 | $699,490 |
| Dec 2025 | $633,750 | $592,465 | $697,269 |
| Nov 2025 | $632,132 | $590,827 | $695,023 |
| Oct 2025 | $631,862 | $590,471 | $693,990 |
| Sep 2025 | $630,423 | $589,043 | $692,328 |
| Aug 2025 | $628,565 | $587,271 | $690,903 |
| Jul 2025 | $626,712 | $585,413 | $689,722 |
| Jun 2025 | $626,386 | $584,818 | $689,964 |
| May 2025 | $627,682 | $585,388 | $692,270 |
| Apr 2025 | $629,701 | $586,849 | $695,186 |
| Mar 2025 | $631,386 | $588,107 | $697,505 |
The trend tells a clear story in two acts. From March to July 2025, prices dipped — falling from $631,386 to $626,386, a drop of about $5,000. Then the market reversed. Since July, values have climbed for seven straight months, gaining $12,061.
That mid-year dip followed by a steady recovery is a common seasonal pattern. Spring listings cool prices briefly before fall and winter buying pushes them back up.
The spread between the cheapest and most expensive ZIPs stayed consistent at roughly $105,000-$106,000 throughout the year. All three neighborhoods moved in the same direction at roughly the same pace.
Is Santa Maria a Good Place to Buy in 2026?
The numbers point to a stable market. A 1.1% annual gain isn’t enough to call it a seller’s market, but seven months of consecutive price increases show consistent demand.
Here’s what the data says for buyers:
- Prices are rising, but slowly. You’re not competing with a 10% annual surge. There’s time to be selective.
- The entry point is under $600K. ZIP 93458 offers the cheapest option in the city.
- Rent is significantly cheaper month to month. You’ll pay a premium to own, so you need to plan on staying long enough to build equity.
- Population is growing. More residents support housing demand over time.
For buyers with a five-plus year horizon and the cash for a 20% down payment, Santa Maria offers relative affordability by California standards. For short-term buyers or those stretching their budget, renting may be the smarter move.
Santa Maria Housing Market Outlook for 2026-2027
Seven consecutive months of price gains suggest the upward trend has momentum. The average monthly increase since July 2025 has been about $1,723.
If the current pace continues, home values could reach roughly $648,000 to $655,000 by late 2026. That would represent annual growth of about 2-3% — still moderate by California standards.
The seasonal dip visible in mid-2025 could repeat. Watch for a brief softening in spring and summer 2026 before another fall recovery. The 12-month data doesn’t show any signs of a sharp correction.
With population still growing and no evidence of a price ceiling being hit, the path of least resistance is slowly upward.
Similar Markets in CA
- Bakersfield — A faster-growing Central Valley city with likely lower median prices than Santa Maria.
- Oxnard — Just down the coast in Ventura County, Oxnard offers a similar coastal California feel.
- Fresno — Matching Santa Maria’s 1.4% population growth, Fresno is a larger Central Valley alternative.
- Chula Vista — San Diego County buyers priced out of the city proper may find this comparison useful.
- Riverside — Inland Empire pricing tends to run below coastal California markets.
Frequently Asked Questions
What is the average home price in Santa Maria?
The average home price in Santa Maria is $638,447 as of February 2026. This figure represents the typical home value across the city’s three tracked ZIP codes, which range from $596,503 in 93458 to $702,181 in 93455.
Are home prices going up or down in Santa Maria?
Prices are going up. Santa Maria home values increased 1.1% year over year. After a brief dip in mid-2025, prices have risen for seven consecutive months through February 2026.
Is it cheaper to rent or buy in Santa Maria?
Renting is cheaper on a monthly basis. In the most affordable ZIP (93458), rent averages $1,945 per month while an estimated mortgage payment would be around $3,016 — a gap of over $1,000 per month. Buying only makes financial sense if you plan to hold the property long enough to build equity.
What is the most affordable neighborhood in Santa Maria?
ZIP code 93458 is the most affordable area in Santa Maria with a median home value of $596,503 — about $42,000 below the city average. Monthly rent in this ZIP is also the lowest at $1,945.
Methodology
Home values are based on the Zillow Home Value Index (ZHVI), a smoothed measure of typical home values in the 35th to 65th percentile range. Rent estimates use the Zillow Observed Rent Index (ZORI). Population figures come from the U.S. Census Bureau Population Estimates Program (2020-2024 vintage). All datasets are publicly available. Housing data updated 2026-02-28.