Stockton Home Prices: $402K, Down 3.3% — 9 ZIPs Analyzed (2026)
$401,962. That’s what a typical home costs in Stockton right now — and it’s falling. Prices dropped 3.3% over the past year, with every single month posting a decline since March 2025. For buyers who’ve been priced out of the Bay Area, Stockton keeps getting a little more affordable.
Quick answer: The average home price in Stockton, CA is $401,962 as of February 2026, down 3.3% year over year according to Zillow.
Current Home Prices in Stockton
| Metric | Value |
|---|---|
| Median Home Price | $401,962 |
| Year-over-Year Change | -3.3% |
| Lowest ZIP Median | $325,016 |
| Highest ZIP Median | $543,724 |
| Number of ZIPs Tracked | 9 |
| Data as of | February 2026 |
The $402K median puts Stockton well below California’s coastal cities but above most of the Central Valley. A year ago, the typical home here cost about $415,600. That’s a loss of roughly $13,700 in value over twelve months.
The price range within the city is wide. The cheapest ZIP sits at $325,016 and the priciest tops $543,724 — a $219K gap. Where you buy matters as much as when you buy.
The decline has been gradual, not a crash. Monthly drops have been small — a few hundred dollars here, a thousand there. This isn’t a market in freefall. It’s a slow correction after years of rapid gains.
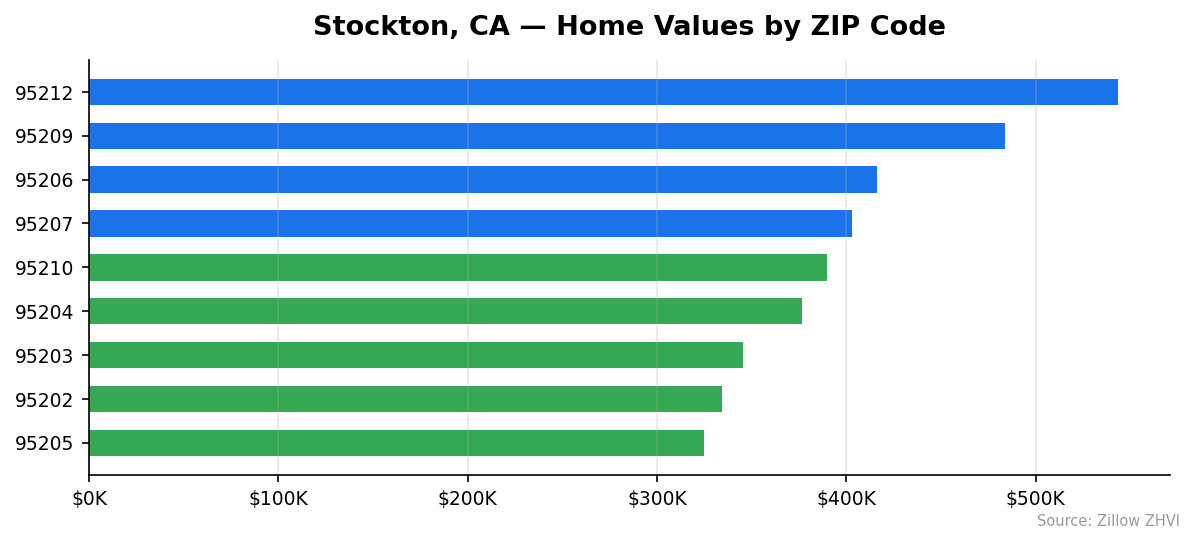
Stockton Home Prices by Neighborhood
| ZIP Code | Median Home Value | Monthly Rent |
|---|---|---|
| 95212 | $543,724 | N/A |
| 95209 | $483,825 | $2,367 |
| 95206 | $415,969 | $2,517 |
| 95207 | $402,980 | $1,821 |
| 95210 | $389,815 | $1,994 |
| 95204 | $376,643 | $1,917 |
| 95203 | $345,538 | $1,615 |
| 95202 | $334,147 | $1,161 |
| 95205 | $325,016 | N/A |
Most Expensive ZIPs
95212 leads the city at $543,724 — 35% above the Stockton median. Rent data isn’t available for this ZIP, but home values here are firmly in the half-million range.
95209 comes in at $483,825, roughly 20% above the city average. Rent runs $2,367/month, making it one of the pricier areas to live whether you buy or rent.
95206 sits at $415,969, just above the citywide median. Notably, it has the highest tracked rent at $2,517/month — more than 95209 despite lower home values.
Most Affordable ZIPs
95205 is the cheapest area in Stockton at $325,016, about 19% below the city average. No rent data is tracked here.
95202 follows at $334,147 with the lowest rent in the city at just $1,161/month. That rent-to-price ratio makes it stand out for investors.
95203 rounds out the bottom three at $345,538 with rent at $1,615/month. Both 95202 and 95203 sit in the downtown core where prices run well below the suburban neighborhoods.
Rent vs Buy in Stockton
Here’s the basic math. The median home at $401,962 with 20% down means a $321,570 mortgage. At a 7% rate on a 30-year fixed loan, your monthly principal and interest payment runs about $2,140. Add property taxes and insurance, and you’re looking at roughly $2,640/month.
The average rent across Stockton’s tracked ZIPs is $1,913/month.
| ZIP | Monthly Rent | Est. Mortgage Payment* |
|---|---|---|
| 95206 | $2,517 | $2,730 |
| 95209 | $2,367 | $3,180 |
| 95210 | $1,994 | $2,560 |
| 95207 | $1,821 | $2,650 |
| 95204 | $1,917 | $2,470 |
| 95203 | $1,615 | $2,270 |
| 95202 | $1,161 | $2,190 |
*Estimated monthly payment assumes 20% down, 7% rate, 30-year fixed, plus estimated taxes and insurance.
Renting is cheaper than buying in every ZIP with available data. The gap is smallest in 95206 — only about $213/month — and widest in 95209 where buying costs roughly $813 more per month. If you’re not sure about staying long-term, renting gives you flexibility at a lower monthly cost.
Population Growth and Migration
Stockton’s population reached 324,975 in 2024. That’s a 1.2% increase from 320,971 in 2020.
| Year | Population |
|---|---|
| 2020 | 320,971 |
| 2021 | 321,737 |
| 2022 | 321,374 |
| 2023 | 322,581 |
| 2024 | 324,975 |
Growth dipped in 2022 — the city actually lost about 360 residents. But 2023 and 2024 brought stronger gains, with 2024 adding nearly 2,400 people in a single year. The city is growing, just slowly.
| City | 2024 Population | 4-Year Growth |
|---|---|---|
| Sacramento | 535,798 | 1.9% |
| Fresno | 550,105 | 1.4% |
| San Diego | 1,404,452 | 1.4% |
| Stockton | 324,975 | 1.2% |
| Bakersfield | 417,468 | 3.0% |
| Oakland | 443,554 | 0.6% |
Stockton’s growth rate of 1.2% trails Bakersfield (3.0%) and Sacramento (1.9%), but outpaces Oakland (0.6%). For housing, slow population growth means demand isn’t surging — which aligns with the declining prices.
Stockton Housing Market Trends
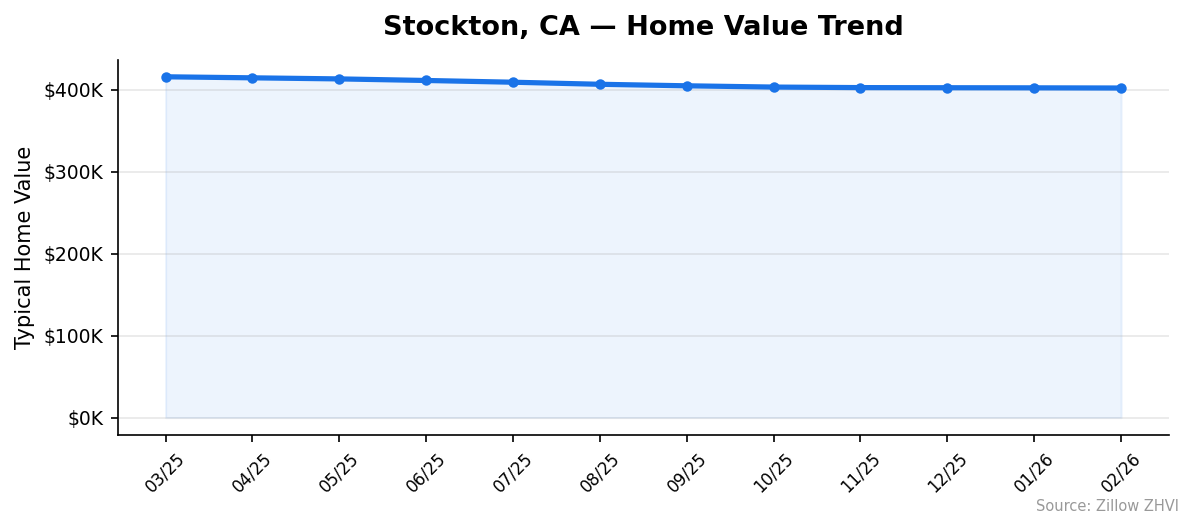
Prices have dropped every month for the past year. Here’s the full timeline.
| Month | Median Price | Month-over-Month Change |
|---|---|---|
| Mar 2025 | $415,651 | — |
| Apr 2025 | $414,382 | -$1,269 |
| May 2025 | $413,073 | -$1,309 |
| Jun 2025 | $411,149 | -$1,924 |
| Jul 2025 | $409,027 | -$2,122 |
| Aug 2025 | $406,509 | -$2,518 |
| Sep 2025 | $404,656 | -$1,853 |
| Oct 2025 | $403,111 | -$1,545 |
| Nov 2025 | $402,468 | -$643 |
| Dec 2025 | $402,310 | -$158 |
| Jan 2026 | $402,173 | -$137 |
| Feb 2026 | $401,962 | -$211 |
The biggest monthly drops happened mid-year. June through August 2025 saw the steepest losses, with August alone shedding $2,518. Since November, the declines have slowed sharply. December and January barely moved — less than $200/month each.
That deceleration matters. The market lost $13,689 over 12 months, but $9,192 of that came in the first six months. The second half of the trend shows a market that’s finding a floor.
Is Stockton a Good Place to Buy in 2026?
The data points toward a buyer’s market. Prices are down 3.3%, declining every month, and rent is meaningfully cheaper than buying. Sellers don’t have the upper hand right now.
For buyers, that’s an advantage — especially if you’re patient. The monthly declines have gotten smaller, which suggests you’re not catching a falling knife anymore. The $402K median is roughly $14K lower than a year ago.
The affordability picture depends on your ZIP. You can get into 95205 or 95202 for under $335K. On the high end, 95212 will run you $544K. That range gives buyers real options at multiple price points.
One caution: with renting cheaper in every neighborhood, the financial case for buying is based on long-term appreciation, not monthly savings. If you’re planning to stay five-plus years, the current dip could work in your favor. If not, renting is the safer play.
Stockton Housing Market Outlook for 2026-2027
The 12-month trend shows a market that’s cooling — but cooling more slowly. The last three months averaged a decline of just $169/month, compared to $1,950/month during the summer of 2025.
If the current pace continues, prices could settle near $400K by mid-2026. The data doesn’t support a major rebound, but the freefall phase appears to be over.
The three-month trend suggests stabilization. Monthly drops under $200 are functionally flat in a $400K market — that’s less than 0.05% per month. Without a shock to mortgage rates or local employment, Stockton prices look likely to hover in the $395K-$405K range through the rest of 2026.
Similar Markets in CA
- Stockton buyers watching Bakersfield might find even lower prices — check Bakersfield.
- Fresno offers a similar Central Valley profile at a comparable price point.
- For a step up in price with more urban amenities, look at Long Beach.
- Southern California buyers can compare with Fontana in the Inland Empire.
- Riverside is another inland alternative worth checking.
Frequently Asked Questions
What is the average home price in Stockton?
The average home price in Stockton is $401,962 as of February 2026. That figure represents the typical home across nine tracked ZIP codes, where values range from $325,016 in 95205 to $543,724 in 95212.
Are home prices going up or down in Stockton?
Prices are going down. The median fell 3.3% year over year, declining every month from March 2025 to February 2026. The pace of decline has slowed significantly since November 2025, with recent months dropping less than $250 each.
Is it cheaper to rent or buy in Stockton?
Renting is cheaper in every Stockton neighborhood with available data. The average rent is about $1,913/month across tracked ZIPs, while a mortgage payment on the median-priced home runs roughly $2,640/month. The gap is smallest in 95206 and largest in 95209.
What is the most affordable neighborhood in Stockton?
ZIP code 95205 has the lowest median home value at $325,016 — about 19% below the city average. The next most affordable areas are 95202 at $334,147 and 95203 at $345,538, both near downtown.
Methodology
Home values are based on the Zillow Home Value Index (ZHVI), a smoothed measure of typical home values in the 35th to 65th percentile range. Rent estimates use the Zillow Observed Rent Index (ZORI). Population figures come from the U.S. Census Bureau Population Estimates Program (2020-2024 vintage). All datasets are publicly available. Housing data updated 2026-02-28.