Sunnyvale Home Prices: $1,955K, Up 0.3% — 4 ZIPs Analyzed (2026)
$1,954,782. That’s what a typical home in Sunnyvale costs right now. In a city where the cheapest ZIP still runs nearly $1.5 million, even modest price shifts move tens of thousands of dollars. Year over year, prices edged up 0.3% — barely above flat.
Quick answer: The average home price in Sunnyvale, CA is $1,954,782 as of February 2026, up 0.3% year over year according to Zillow.
Current Home Prices in Sunnyvale
| Metric | Value |
|---|---|
| Median Home Value | $1,954,782 |
| Year-over-Year Change | +0.3% |
| Lowest ZIP Median | $1,469,517 |
| Highest ZIP Median | $2,834,063 |
| Number of ZIPs Tracked | 4 |
| Data Through | February 2026 |
The 0.3% annual gain translates to roughly $5,900 in added value. In a market where homes approach $2 million, that’s rounding error. Sunnyvale prices are effectively flat compared to a year ago.
The gap between the cheapest and most expensive neighborhoods is staggering: $1,364,546 separates the floor from the ceiling. If you’re shopping in Sunnyvale, the ZIP code matters more than almost anything else.
Worth noting: the city sits inside the San Jose-Sunnyvale-Santa Clara metro, one of the priciest in the country. Even at $1.95 million, Sunnyvale falls in the middle of Silicon Valley pricing.
Sunnyvale Home Prices by Neighborhood
| ZIP Code | Median Home Value | Monthly Rent |
|---|---|---|
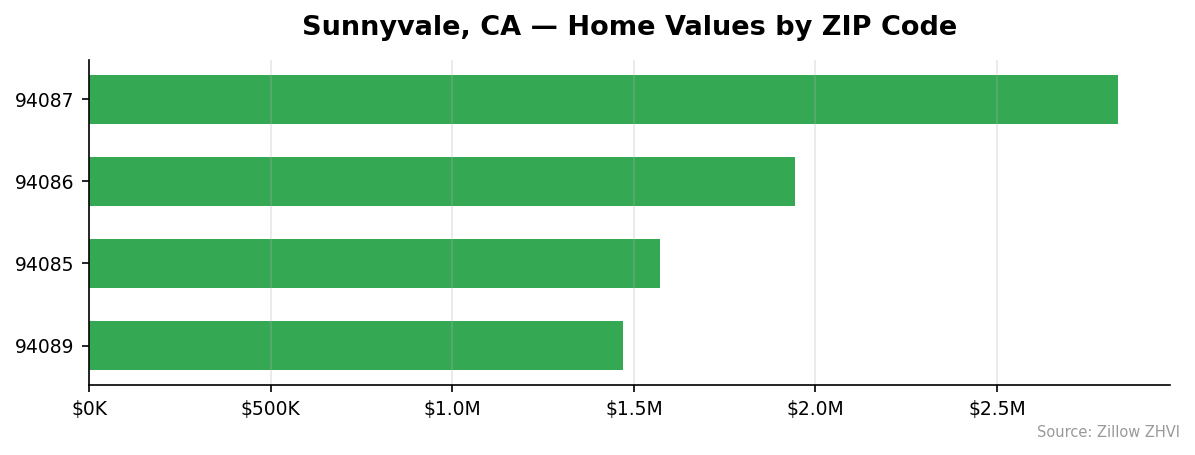
| 94087 | $2,834,063 | $3,325 |
| 94086 | $1,942,574 | $3,620 |
| 94085 | $1,572,975 | $3,624 |
| 94089 | $1,469,517 | $3,273 |
Most Expensive
94087 leads at $2,834,063 — nearly 45% above the city average. Despite the highest home prices, rent here is actually the second-lowest at $3,325/month, which suggests more owner-occupancy and fewer rental units.
Most Affordable
94089 is the entry point at $1,469,517, about 25% below the city median. Rent runs $3,273/month, the lowest in Sunnyvale. 94085 comes in next at $1,572,975. Both ZIPs sit in the southern part of the city.
An odd pattern in the data: rent prices don’t track home values. The two cheapest ZIPs by home price (94089 and 94085) have rents within $350 of the most expensive ZIP. You pay far more to own in 94087, but renting there costs less than renting in 94086.
Rent vs Buy in Sunnyvale
Average rent across Sunnyvale’s four tracked ZIP codes is approximately $3,460 per month.
| ZIP Code | Monthly Rent | Estimated Monthly Mortgage* |
|---|---|---|
| 94087 | $3,325 | ~$15,100 |
| 94086 | $3,620 | ~$10,350 |
| 94085 | $3,624 | ~$8,380 |
| 94089 | $3,273 | ~$7,830 |
*Estimated at 6.5% rate, 20% down, 30-year fixed. Principal and interest only — does not include taxes, insurance, or HOA.
The math isn’t close. Even in the cheapest ZIP, buying costs more than double what renting does. In 94087, a mortgage runs roughly 4.5x the rent.
This gap makes Sunnyvale one of the most renter-favorable markets in the country by pure monthly cost. If you’re making a purely financial decision and aren’t betting on appreciation, renting wins by a wide margin right now. The 0.3% annual price gain doesn’t come close to justifying the monthly premium of ownership.
Population Growth and Migration
Sunnyvale’s population reached 156,792 in 2024, a 1.0% increase from 155,261 in 2020.
| Year | Population |
|---|---|
| 2020 | 155,261 |
| 2021 | 152,444 |
| 2022 | 152,618 |
| 2023 | 154,053 |
| 2024 | 156,792 |
The trend tells an interesting story. Sunnyvale lost nearly 2,800 residents between 2020 and 2021 — likely pandemic-driven remote work departures. The city has since recovered all of those losses and then some, adding over 4,300 people from the 2021 low.
How does Sunnyvale compare to other California cities?
| City | 2024 Population | 4-Year Growth |
|---|---|---|
| Bakersfield | 417,468 | +3.0% |
| Sacramento | 535,798 | +1.9% |
| San Diego | 1,404,452 | +1.4% |
| Fresno | 550,105 | +1.4% |
| Sunnyvale | 156,792 | +1.0% |
| Oakland | 443,554 | +0.6% |
Sunnyvale’s 1.0% growth trails larger California cities like Sacramento and San Diego. But it’s growing, and in a city with nearly $2 million median home prices, even modest population gains keep demand pressure on an already constrained market.
Sunnyvale Housing Market Trends
| Month | Average Value | Range Low | Range High |
|---|---|---|---|
| Feb 2026 | $1,954,782 | $1,469,517 | $2,834,063 |
| Jan 2026 | $1,960,015 | $1,475,317 | $2,840,293 |
| Dec 2025 | $1,953,089 | $1,472,698 | $2,826,129 |
| Nov 2025 | $1,933,953 | $1,461,113 | $2,792,308 |
| Oct 2025 | $1,911,011 | $1,446,312 | $2,752,424 |
| Sep 2025 | $1,891,444 | $1,430,169 | $2,721,956 |
| Aug 2025 | $1,877,356 | $1,418,654 | $2,698,653 |
| Jul 2025 | $1,877,109 | $1,418,355 | $2,695,585 |
| Jun 2025 | $1,889,184 | $1,431,253 | $2,710,140 |
| May 2025 | $1,911,561 | $1,452,528 | $2,742,840 |
| Apr 2025 | $1,932,683 | $1,472,447 | $2,773,864 |
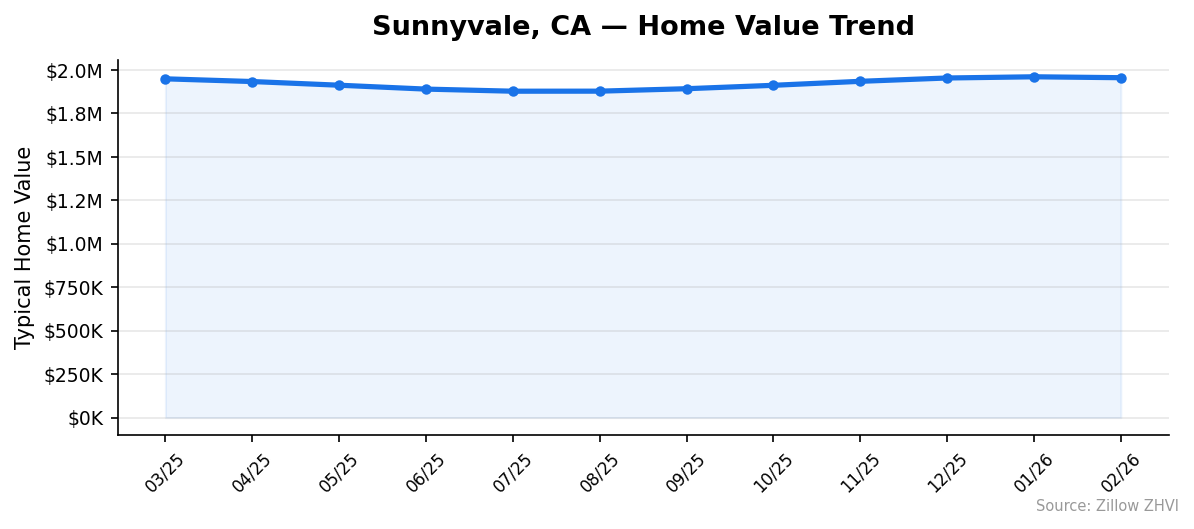
| Mar 2025 | $1,948,296 | $1,486,379 | $2,797,598 |
Sunnyvale prices followed a U-shaped curve over the past year. Values dropped from $1,948,296 in March 2025 down to $1,877,109 in July — a 3.7% decline over four months. Then the market reversed. Prices climbed steadily from August through January 2026, gaining $82,906 in six months.
February saw a slight pullback of $5,233 from January’s peak. One month doesn’t make a trend, but it breaks the six-month streak of gains.
Is Sunnyvale a Good Place to Buy in 2026?
The numbers paint a market in near-equilibrium. A 0.3% annual gain means prices are essentially holding steady. For buyers, that means no urgency — you’re not chasing a runaway market. For sellers, there’s no wave of appreciation to ride.
The rent-vs-buy gap is the biggest factor working against ownership right now. You’d pay $7,000 to $12,000 more per month to own versus rent in most ZIPs. That premium only makes sense if you expect strong future appreciation or plan to stay long-term.
If you have the capital and a 7+ year horizon, Sunnyvale’s tight housing supply and proximity to major tech employers provide a floor under prices. If you’re looking at a 2-3 year stay, renting is the clear financial choice.
Sunnyvale Housing Market Outlook for 2026-2027
The six-month upswing from July to January 2025-2026 added $82,906 to the average home value — about $13,800 per month. February’s slight dip interrupted that climb but didn’t reverse it.
If the current pace from the past three months continues, prices could push past $1,970,000 by mid-2026. But last year showed a seasonal pattern: prices fell from spring through midsummer before recovering. A similar seasonal dip in mid-2026 wouldn’t be surprising.
The 12-month data suggests Sunnyvale is range-bound between roughly $1.88M and $1.96M. Without a significant shift in interest rates or local housing supply, expect prices to oscillate within that band through 2027.
Similar Markets in CA
- Los Angeles — A much larger market where median prices run well below Sunnyvale’s $1.95M level.
- San Diego — Coastal California with strong population growth of 1.4%, but significantly more affordable than Silicon Valley.
- Anaheim — Southern California option for buyers priced out of the Bay Area.
- Bakersfield — The fastest-growing California city on our list at 3.0%, with prices a fraction of Sunnyvale’s.
- Fresno — Central Valley pricing offers a stark contrast to Silicon Valley for remote workers who don’t need a daily commute.
Frequently Asked Questions
What is the average home price in Sunnyvale?
The average home price in Sunnyvale is $1,954,782 as of February 2026. Across the city’s four tracked ZIP codes, values range from $1,469,517 in 94089 to $2,834,063 in 94087.
Are home prices going up or down in Sunnyvale?
Prices are up 0.3% year over year — essentially flat. The market dipped 3.7% from March to July 2025, then recovered through January 2026. February showed a minor pullback of about $5,200.
Is it cheaper to rent or buy in Sunnyvale?
Renting is far cheaper. Average rent runs about $3,460/month while a mortgage on the median-priced home would cost roughly $10,400/month (6.5% rate, 20% down). Even in the most affordable ZIP, buying costs more than double renting.
What is the most affordable neighborhood in Sunnyvale?
ZIP code 94089 has the lowest median home value at $1,469,517 and the lowest rent at $3,273/month. It sits about 25% below the citywide median. The next most affordable is 94085 at $1,572,975.
Methodology
Home values are based on the Zillow Home Value Index (ZHVI), a smoothed measure of typical home values in the 35th to 65th percentile range. Rent estimates use the Zillow Observed Rent Index (ZORI). Population figures come from the U.S. Census Bureau Population Estimates Program (2020-2024 vintage). All datasets are publicly available. Housing data updated 2026-02-28.