Troy Home Prices: $255K, Up 1.8% — 3 ZIPs Analyzed (2026)
$255,323. That’s what a typical home costs in Troy, NY right now. Prices are up 1.8% from a year ago — modest growth, but growth nonetheless in a city where homes still cost a fraction of what you’d pay downstate.
Quick answer: The average home price in Troy, NY is $255,323 as of February 2026, up 1.8% year over year according to Zillow.
Current Home Prices in Troy
Troy sits in the Albany-Schenectady-Troy metro area, and its housing market has been quietly ticking upward. Here’s where things stand:
| Metric | Value |
|---|---|
| Median Home Value | $255,323 |
| Year-over-Year Change | +1.8% |
| Lowest ZIP Value | $223,362 |
| Highest ZIP Value | $292,753 |
| Number of ZIPs Tracked | 3 |
| Data as of | February 2026 |
That 1.8% annual gain works out to roughly $4,600 in added equity over 12 months. Not a windfall, but not a loss either.
The spread between Troy’s cheapest and most expensive ZIP codes is about $69,400. That’s a meaningful gap for a city this size — your neighborhood choice can swing your purchase price by nearly 30%.
Troy remains well below the statewide cost of living you’d find in New York City or its suburbs. For buyers priced out of the Hudson Valley or Capital District hotspots, Troy offers entry-level prices with proximity to Albany’s job market.
Troy Home Prices by Neighborhood
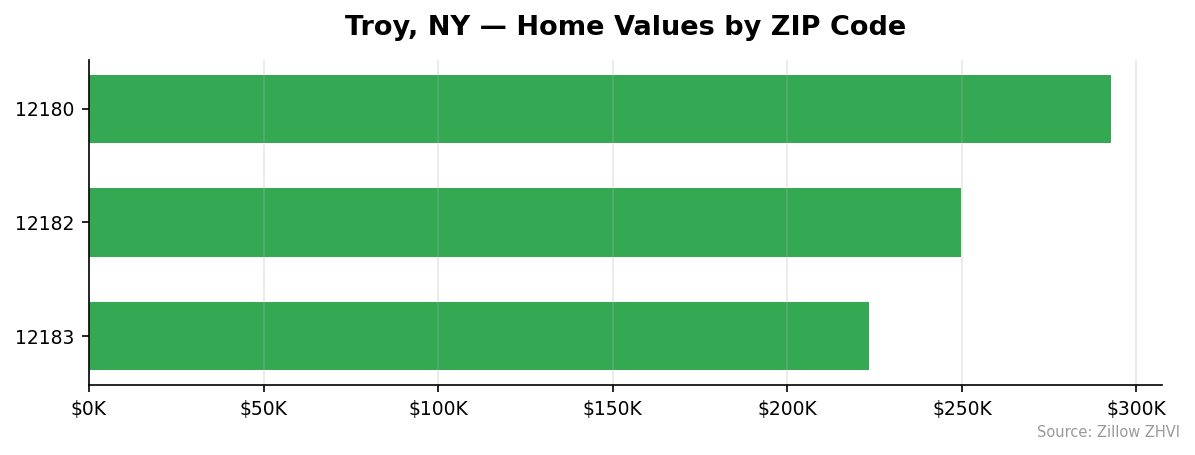
Troy has three tracked ZIP codes, each with a distinct price point.
| ZIP Code | Typical Home Value | Typical Rent |
|---|---|---|
| 12180 | $292,753 | $1,491/mo |
| 12182 | $249,854 | $1,353/mo |
| 12183 | $223,362 | N/A |
Most Expensive
12180 tops the list at $292,753 — about $37,400 above the city median. It also commands the highest rents at $1,491 per month, suggesting strong demand from both buyers and renters.
Most Affordable
12183 is the cheapest area at $223,362, roughly 12.5% below the city average. No rent data is available for this ZIP, which may indicate a smaller rental market with more owner-occupied homes.
12182 splits the difference at $249,854. Rents here run $1,353 per month — $138 less than 12180 — making it a middle-ground option for buyers who want to stay near the city median.
Rent vs Buy in Troy
Rent data is available for two of Troy’s three ZIP codes. Here’s how the numbers compare to buying:
| ZIP Code | Monthly Rent | Est. Mortgage Payment* |
|---|---|---|
| 12180 | $1,491 | ~$1,925 |
| 12182 | $1,353 | ~$1,643 |
*Estimated mortgage based on the ZIP’s typical home value, 20% down, 6.8% rate, 30-year fixed. Does not include taxes, insurance, or HOA fees.
In both ZIPs, renting is cheaper on a pure monthly-cost basis. The gap is $434 per month in 12180 and $290 in 12182.
But that monthly math doesn’t capture the full picture. A portion of each mortgage payment builds equity. At current appreciation rates of 1.8% annually, a $255K home gains roughly $383 per month in value. Factor that in, and the effective cost gap narrows considerably.
For buyers who plan to stay five or more years, buying at Troy’s price levels can make sense — especially with the equity buildup. Short-term residents are better off renting.
Population Growth and Migration
Troy’s population has been nearly flat over the past four years, with a slight decline of 0.5%.
| Year | Population |
|---|---|
| 2020 | 51,311 |
| 2021 | 51,192 |
| 2022 | 50,807 |
| 2023 | 50,800 |
| 2024 | 51,065 |
The city dipped to 50,800 in 2023 before recovering slightly to 51,065 in 2024. That rebound is small — 265 people — but it broke a three-year declining trend.
Here’s how Troy compares to other New York cities:
| City | 2024 Population | 4-Year Growth |
|---|---|---|
| New Rochelle | 85,512 | +6.6% |
| Albany | 101,317 | +2.7% |
| Schenectady | 69,495 | +1.7% |
| Yonkers | 211,040 | 0.0% |
| Troy | 51,065 | -0.5% |
| Buffalo | 276,617 | -0.3% |
Troy and Buffalo are the only cities on this list losing residents. Albany and Schenectady — Troy’s metro neighbors — are both growing, which suggests regional demand exists but is flowing to other parts of the Capital District.
Flat population means flat housing demand from organic growth. Troy’s price gains are more likely driven by affordability migration — buyers from pricier markets moving in — rather than local population pressure.
Troy Housing Market Trends
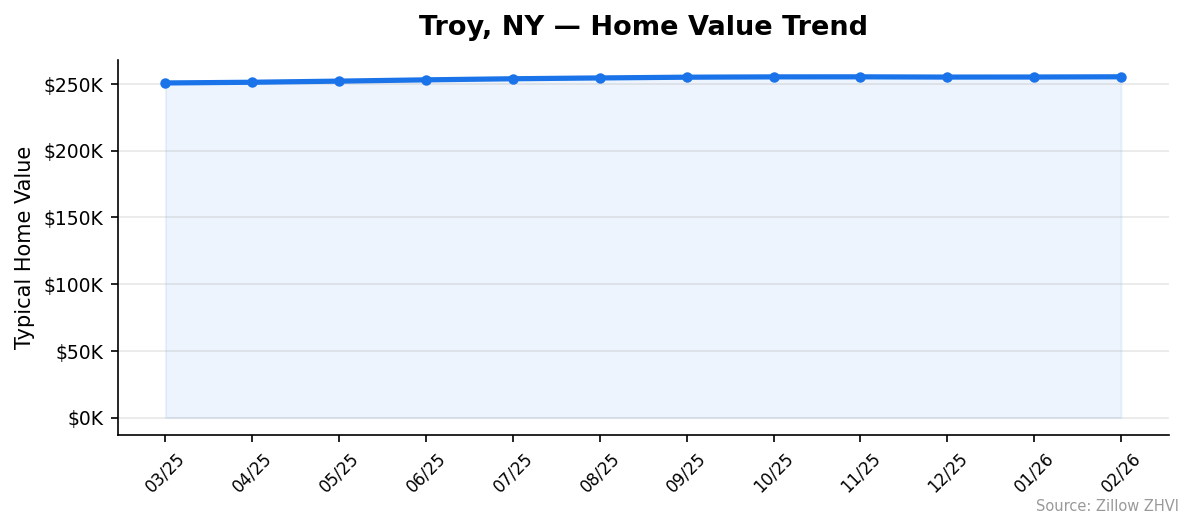
Here’s how Troy’s median home value has moved over the past 12 months:
| Month | Median Value | Monthly Change |
|---|---|---|
| Feb 2026 | $255,323 | +$165 |
| Jan 2026 | $255,158 | +$50 |
| Dec 2025 | $255,108 | -$181 |
| Nov 2025 | $255,289 | +$33 |
| Oct 2025 | $255,256 | +$237 |
| Sep 2025 | $255,019 | +$558 |
| Aug 2025 | $254,461 | +$608 |
| Jul 2025 | $253,853 | +$820 |
| Jun 2025 | $253,033 | +$960 |
| May 2025 | $252,073 | +$840 |
| Apr 2025 | $251,233 | +$531 |
| Mar 2025 | $250,702 | — |
The trend tells a clear story: steady gains from spring through summer 2025, then a slowdown into winter. Monthly increases peaked at $960 in June 2025 and have decelerated to near-zero by early 2026.
Over 12 months, Troy gained $4,621 in median value — a slow, grinding appreciation. No month posted a significant decline. The worst month was December 2025, which dipped $181 before recovering.
Is Troy a Good Place to Buy in 2026?
Troy’s data points to a stable, buyer-friendly market.
Prices are rising slowly — 1.8% per year won’t price you out next month. The spread between ZIPs gives you options: you can spend $223K in 12183 or $293K in 12180. Rents are reasonable, which limits bidding pressure from investors chasing yield.
The downside: flat population growth means you shouldn’t expect rapid appreciation. This is not a market where you buy and flip in two years. It’s a market where you buy, live in the home, and build equity gradually.
For first-time buyers or people relocating to the Capital District for work, Troy offers an affordable entry point. You’re 10 minutes from Albany, and you’re paying about $255K instead of the higher prices in some Albany neighborhoods.
Troy Housing Market Outlook for 2026-2027
The 12-month trend shows Troy’s appreciation rate is cooling. Monthly gains dropped from $800-$960 in mid-2025 to under $200 by early 2026.
If the current pace continues, expect prices to drift sideways through mid-2026. The seasonal pattern suggests a pickup in spring and summer — Troy saw its strongest monthly gains between May and July 2025.
The 3-month trend from December 2025 through February 2026 shows gains of essentially zero (+$215 total over three months). That’s not a decline, but it’s barely treading water.
Don’t expect a crash. Don’t expect a boom. Troy’s market is likely to deliver another 1-2% of appreciation over the next 12 months, barring major shifts in mortgage rates or the regional economy.
Similar Markets in NY
If you’re considering Troy, these New York markets are worth comparing:
- Albany — Troy’s neighbor and the state capital, with a larger job market and growing population.
- Schenectady — The third city in the Capital District metro, also seeing population growth.
- Buffalo — Similar population trend to Troy, with a much larger city footprint.
- Syracuse — Another upstate option for buyers seeking affordability.
- Rochester — Upstate’s other mid-size market, often compared to the Capital District for cost of living.
Frequently Asked Questions
What is the average home price in Troy?
The average home price in Troy, NY is $255,323 as of February 2026. This figure represents the typical home value across all three tracked ZIP codes, which range from $223,362 in 12183 to $292,753 in 12180.
Are home prices going up or down in Troy?
Prices are up 1.8% year over year. The increase has been steady but slow — Troy gained about $4,600 in median value over the past 12 months. Monthly gains have decelerated since mid-2025, suggesting the pace of appreciation is cooling.
Is it cheaper to rent or buy in Troy?
Renting is cheaper on a monthly basis. Typical rents range from $1,353 to $1,491, while estimated mortgage payments run $1,643 to $1,925 (assuming 20% down at 6.8%). However, mortgage payments build equity, and at 1.8% annual appreciation, the effective cost gap is smaller than the raw numbers suggest.
What is the most affordable neighborhood in Troy?
ZIP code 12183 has the lowest typical home value at $223,362 — about $32,000 below the city median. This ZIP sits roughly 12.5% below Troy’s average, making it the most accessible entry point for buyers on a budget.
Methodology
Home values are based on the Zillow Home Value Index (ZHVI), a smoothed measure of typical home values in the 35th to 65th percentile range. Rent estimates use the Zillow Observed Rent Index (ZORI). Population figures come from the U.S. Census Bureau Population Estimates Program (2020-2024 vintage). All datasets are publicly available. Housing data updated 2026-02-28.