Vallejo Home Prices: $563K, Down 5% — 4 ZIPs Analyzed (2026)
Prices dropped for the tenth straight month in Vallejo. The median home now sits at $563,429 — down 5.0% from a year ago. That’s a loss of roughly $30,000 in value over twelve months, and the slide shows no sign of reversing.
Quick answer: The average home price in Vallejo, CA is $563,429 as of February 2026, down 5.0% year over year according to Zillow.
Current Home Prices in Vallejo
Here’s where the Vallejo housing market stands right now.
| Metric | Value |
|---|---|
| Median Home Price | $563,429 |
| Year-over-Year Change | -5.0% |
| Lowest ZIP Median | $453,895 |
| Highest ZIP Median | $715,503 |
| Number of ZIPs Tracked | 4 |
| Data as of | February 2026 |
A 5% annual decline is notable for any California market. Vallejo peaked near $593,236 in March 2025 and has dropped every single month since. The gap between the cheapest and most expensive ZIP code is $261,608 — meaning where you buy within city limits matters enormously.
For buyers, the current median translates to a monthly mortgage payment of roughly $3,560 on a 30-year loan at 6.5% (assuming 20% down on $563,429). Add property taxes and insurance, and you’re looking at closer to $4,200/month.
The year-over-year decline is broad-based. No ZIP code in Vallejo has bucked the downward trend. This isn’t a story about one struggling neighborhood dragging down the average — the correction is citywide.
Vallejo Home Prices by Neighborhood
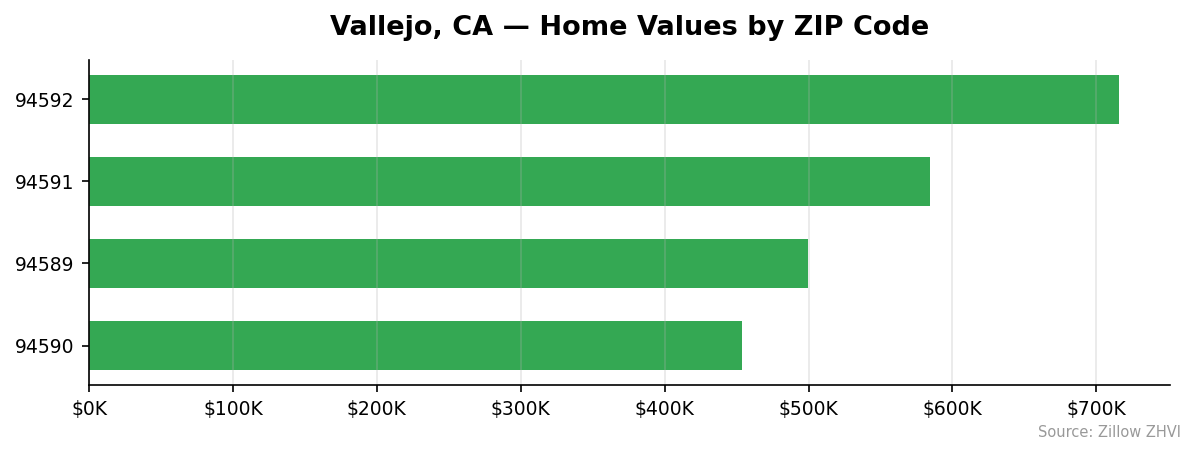
All four tracked ZIP codes in Vallejo show significant price variation.
| ZIP Code | Median Home Value | Median Rent | vs. City Average |
|---|---|---|---|
| 94592 | $715,503 | N/A | +27.0% |
| 94591 | $584,772 | $2,253/mo | +3.8% |
| 94589 | $499,547 | $2,427/mo | -11.3% |
| 94590 | $453,895 | $1,996/mo | -19.4% |
Most Expensive
94592 leads at $715,503, sitting 27% above the city average — the only ZIP to break the $700K mark. No rent data is available for this area, suggesting it skews heavily toward owner-occupied homes.
Most Affordable
94590 is the entry point at $453,895 with the lowest rent at $1,996/month. It’s the only ZIP below $500K, making it a target for first-time buyers priced out of other Vallejo neighborhoods.
94589 comes in at $499,547 but carries the highest rent in the city at $2,427/month. That rent-to-price ratio makes it an interesting area for investors.
Rent vs Buy in Vallejo
Three of Vallejo’s four ZIP codes have rent data available.
| ZIP Code | Monthly Rent | Est. Monthly Mortgage* |
|---|---|---|
| 94591 | $2,253 | $2,954 |
| 94590 | $1,996 | $2,286 |
| 94589 | $2,427 | $2,524 |
*Estimated mortgage: 30-year fixed at 6.5%, 20% down, principal and interest only.
Renting is cheaper than buying in every ZIP code. The gap is smallest in 94589, where rent ($2,427) nearly matches the estimated mortgage payment ($2,524). That $97 difference disappears entirely once you add property taxes, insurance, and maintenance.
In 94591, the gap widens to about $700/month. And these mortgage estimates don’t include California’s property taxes (roughly 1.1% of assessed value) or homeowner’s insurance.
With prices actively falling at 5% per year, the math tilts further toward renting. A buyer who purchased at last March’s peak has already lost about $30,000 in equity. Renters kept that money in the bank.
The one counterargument: mortgage payments are fixed. Rents can rise. But in a market losing value, the opportunity cost of buying is real.
Population Growth and Migration
Vallejo is losing residents. The city’s population dropped from 125,930 in 2020 to 123,475 in 2024 — a 1.9% decline.
| Year | Population | Change |
|---|---|---|
| 2020 | 125,930 | — |
| 2021 | 124,810 | -1,120 |
| 2022 | 123,934 | -876 |
| 2023 | 123,292 | -642 |
| 2024 | 123,475 | +183 |
The bleeding slowed. After losing over 1,100 residents in 2021, the outflow shrank each year. In 2024, Vallejo actually gained 183 people — the first increase in four years. It’s too early to call it a reversal, but the hemorrhaging has stopped.
Compared to other California cities, Vallejo’s population loss stands out.
| City | 2024 Population | 4-Year Growth |
|---|---|---|
| Bakersfield | 417,468 | +3.0% |
| Sacramento | 535,798 | +1.9% |
| San Diego | 1,404,452 | +1.4% |
| Fresno | 550,105 | +1.4% |
| Oakland | 443,554 | +0.6% |
| Vallejo | 123,475 | -1.9% |
Every comparable city grew while Vallejo shrank. Less demand for housing means less upward pressure on prices. The population trend helps explain why Vallejo’s home values are falling when many California markets are holding steady.
Vallejo Housing Market Trends
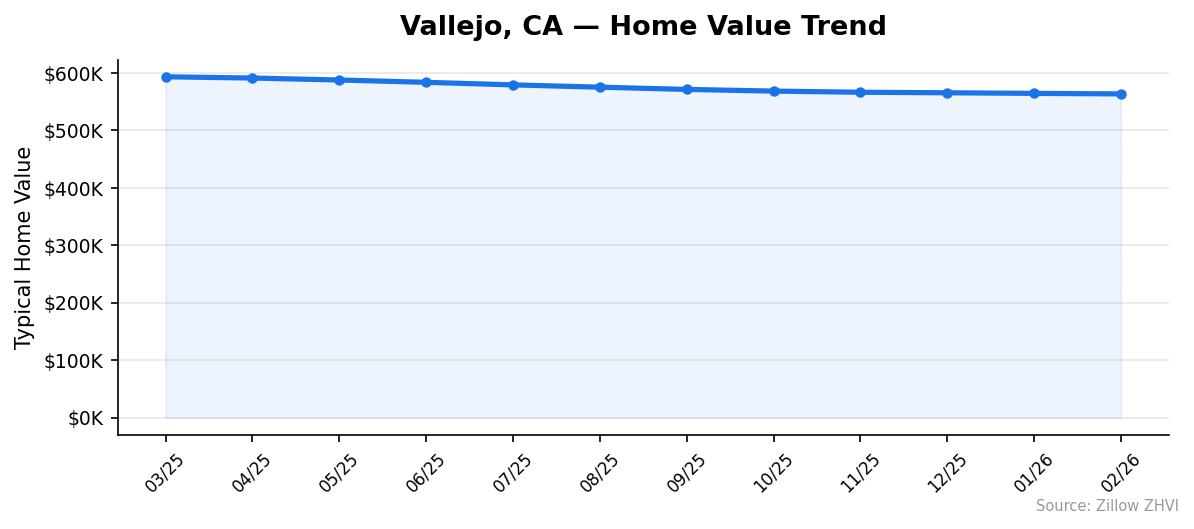
The 12-month price trajectory tells a clear story: steady, uninterrupted decline.
| Month | Average Price | Monthly Change |
|---|---|---|
| Mar 2025 | $593,236 | — |
| Apr 2025 | $591,068 | -$2,168 |
| May 2025 | $587,645 | -$3,423 |
| Jun 2025 | $583,618 | -$4,027 |
| Jul 2025 | $579,144 | -$4,474 |
| Aug 2025 | $575,161 | -$3,983 |
| Sep 2025 | $571,270 | -$3,891 |
| Oct 2025 | $568,337 | -$2,933 |
| Nov 2025 | $566,332 | -$2,005 |
| Dec 2025 | $565,394 | -$938 |
| Jan 2026 | $564,375 | -$1,019 |
| Feb 2026 | $563,429 | -$946 |
The pace of decline is slowing. Summer 2025 saw drops of $3,900–$4,400 per month. By winter, that slowed to under $1,000 per month. The total loss from peak to current: $29,807.
This deceleration is worth watching. A flattening curve could mean the market is finding a floor — or it could be seasonal, with prices typically softening less in winter months.
Is Vallejo a Good Place to Buy in 2026?
The data points to a buyer’s market. Prices are down 5% year over year, the city is losing population, and renting is cheaper than buying in every neighborhood.
If you’re an investor, the numbers don’t favor buying right now. Falling prices erode returns, and cap rates need to account for continued depreciation. ZIP 94589 offers the most interesting rent-to-price ratio, but that alone doesn’t make a deal.
If you’re buying a home to live in for 5+ years, the calculus changes. You’re getting into a California market under $565K. That’s affordable by Bay Area standards. The 94590 ZIP at $454K is genuinely within reach for median-income households.
The risk: prices could keep falling. The reward: you’re buying at a 5% discount compared to a year ago, and the rate of decline is slowing.
Vallejo Housing Market Outlook for 2026-2027
The 3-month trend suggests the decline is losing momentum. From December 2025 through February 2026, prices dropped less than $1,000 per month — a sharp slowdown from the $3,000–$4,000 monthly drops in mid-2025.
If the current pace continues, Vallejo could see prices flatten by mid-2026. A sub-$1,000 monthly decline puts the market on track for a total drop of about 1-2% over the next six months, landing somewhere around $555,000–$558,000 by late summer.
The population data adds a wildcard. The slight uptick in 2024 (+183 residents) hints at stabilizing demand. If that trend holds, it could put a floor under home values.
Don’t expect a rebound. The trend is clearly downward, and nothing in the data suggests a sudden reversal. But the freefall phase appears to be over.
Similar Markets in CA
If you’re exploring the California market beyond Vallejo, here are some cities worth comparing.
- Bakersfield — A growing inland city with a population of 417,468 and positive growth, likely offering lower price points than Vallejo.
- Fresno — Another Central Valley market with 550,105 residents and 1.4% population growth, a contrast to Vallejo’s shrinking base.
- Long Beach — A coastal Southern California city for buyers who want urban amenities and are willing to pay more.
- Fontana — An Inland Empire option for buyers looking for more space at potentially lower prices than Bay Area markets.
- Riverside — A large Southern California market that often undercuts coastal prices while offering proximity to Los Angeles.
Frequently Asked Questions
What is the average home price in Vallejo?
The average home price in Vallejo is $563,429 as of February 2026. This represents the typical home value across four tracked ZIP codes, where prices range from $453,895 in ZIP 94590 to $715,503 in ZIP 94592.
Are home prices going up or down in Vallejo?
Prices are going down. Vallejo home values fell 5.0% year over year, declining every month for at least 12 consecutive months. The rate of decline has slowed in recent months, dropping less than $1,000/month since December 2025.
Is it cheaper to rent or buy in Vallejo?
Renting is cheaper. Median rents range from $1,996 to $2,427/month depending on the neighborhood. A mortgage on the median-priced home would run about $3,560/month (principal and interest only, 20% down at 6.5%). After taxes and insurance, the gap widens further.
What is the most affordable neighborhood in Vallejo?
ZIP code 94590 is the most affordable area with a median home value of $453,895 — about 19% below the city average. It also has the lowest rent in the city at $1,996/month.
Methodology
Home values are based on the Zillow Home Value Index (ZHVI), a smoothed measure of typical home values in the 35th to 65th percentile range. Rent estimates use the Zillow Observed Rent Index (ZORI). Population figures come from the U.S. Census Bureau Population Estimates Program (2020-2024 vintage). All datasets are publicly available. Housing data updated 2026-02-28.