Victorville Home Prices: $428K, Down 1.6% — 3 ZIPs Analyzed (2026)
$428K. That’s what a typical home costs in Victorville right now — and it’s heading in the wrong direction for sellers. Prices dropped 1.6% over the past year, part of a slide that began in spring 2025. For buyers watching the High Desert market, the numbers are finally moving your way.
Quick answer: The average home price in Victorville, CA is $427,674 as of February 2026, down 1.6% year over year according to Zillow.
Current Home Prices in Victorville
Here’s where the market stands:
| Metric | Value |
|---|---|
| Median Home Price | $427,674 |
| Year-over-Year Change | -1.6% |
| Lowest ZIP Median | $410,401 |
| Highest ZIP Median | $445,386 |
| ZIP Codes Tracked | 3 |
| Data as of | February 2026 |
The $35,000 gap between the cheapest and most expensive ZIP codes tells you Victorville isn’t one market — it’s three. That spread matters if you’re shopping on a budget.
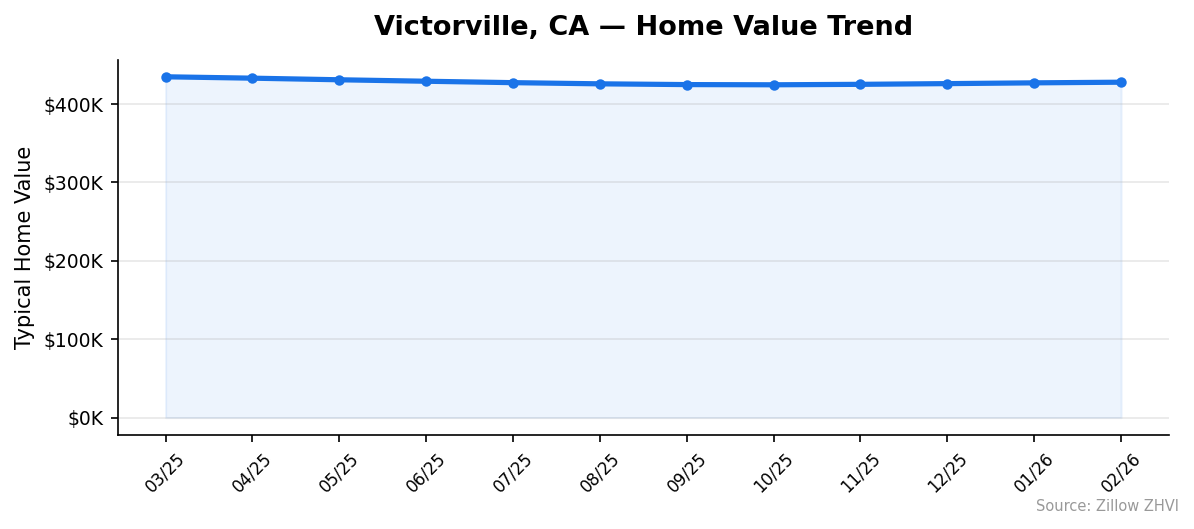
A year ago, the median sat closer to $435,000. The decline has been gradual, not a cliff. Prices dipped about $800 to $1,000 per month through the second half of 2025, then flattened heading into 2026. February’s $427,674 reading is actually up slightly from January’s $426,848, which could signal the bottom — or just a seasonal blip.
For context, the metro area is the Riverside-San Bernardino-Ontario market. Victorville sits on the affordable end of the Inland Empire, which is part of its appeal for buyers priced out of coastal Southern California.
Victorville Home Prices by Neighborhood
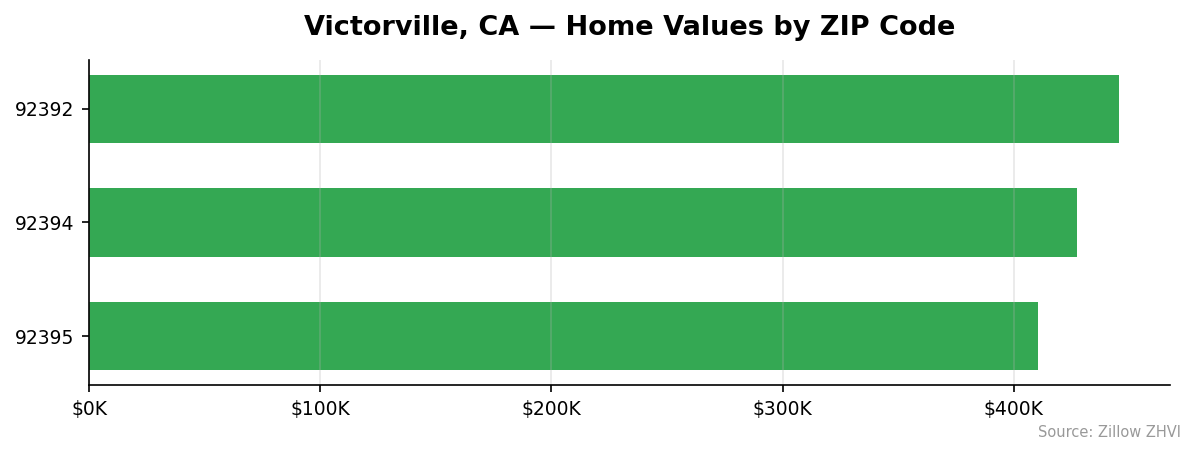
All three Victorville ZIP codes and their current data:
| ZIP Code | Median Home Price | Monthly Rent |
|---|---|---|
| 92392 | $445,386 | $2,386/mo |
| 92394 | $427,235 | $2,420/mo |
| 92395 | $410,401 | $1,811/mo |
Most Expensive
92392 leads at $445,386 — about $18,000 above the city average. Despite having the highest home prices, its rent of $2,386/month is actually lower than 92394, which makes it relatively better for owners versus renters.
Most Affordable
92395 comes in at $410,401, roughly $17,000 below the city median. Rent here is just $1,811/month — the lowest in Victorville by a wide margin. If you’re looking for the cheapest entry point, this is it.
The middle ground is 92394 at $427,235, which sits almost exactly at the city average. Interestingly, 92394 commands the highest rent at $2,420/month despite not having the highest home values. That gap between price and rent makes it worth a closer look for investors.
Rent vs Buy in Victorville
Let’s do the math. Take the city median of $427,674. Put 20% down ($85,535) and finance the rest at a 6.8% rate over 30 years. Your monthly principal and interest payment comes to roughly $2,230. Add property taxes and insurance, and you’re looking at about $2,700/month all in.
Now look at rents:
| ZIP Code | Monthly Rent |
|---|---|
| 92392 | $2,386 |
| 92394 | $2,420 |
| 92395 | $1,811 |
The city-wide average rent is about $2,205/month. That’s cheaper than a mortgage payment on the median home by around $500/month once you factor in taxes and insurance.
In 92395, the gap is even wider. Rent at $1,811 is well below what you’d pay to own. In 92394, renting at $2,420 gets closer to ownership costs, but you’re still saving a few hundred dollars.
The case for buying is equity. You’re paying down a mortgage instead of paying a landlord. But with prices still sliding, buying today means your home could be worth less in six months. For now, renters in Victorville have the math on their side — especially in 92395.
Population Growth and Migration
Victorville is growing faster than most California cities. The population rose from 134,721 in 2020 to 140,721 in 2024 — a 4.5% increase over four years.
| Year | Population |
|---|---|
| 2020 | 134,721 |
| 2021 | 136,123 |
| 2022 | 137,515 |
| 2023 | 139,111 |
| 2024 | 140,721 |
Growth has been steady, adding roughly 1,500 people per year. That consistency matters more than the raw number. It suggests ongoing demand for housing.
How does that compare to other California cities?
| City | 2024 Population | 4-Year Growth |
|---|---|---|
| Victorville | 140,721 | 4.5% |
| Bakersfield | 417,468 | 3.0% |
| Sacramento | 535,798 | 1.9% |
| San Diego | 1,404,452 | 1.4% |
| Fresno | 550,105 | 1.4% |
| Oakland | 443,554 | 0.6% |
Victorville’s 4.5% growth rate tops all five comparison cities. It’s growing at more than triple the rate of Oakland and more than three times the pace of San Diego. The High Desert continues to attract residents looking for lower costs while staying within commuting distance of the greater Los Angeles area.
That population growth puts a floor under housing demand. More people need places to live, which limits how far prices can fall.
Victorville Housing Market Trends
Here’s how the median home price moved over the past 12 months:
| Month | Median Price | Monthly Change |
|---|---|---|
| Feb 2026 | $427,674 | +$826 |
| Jan 2026 | $426,848 | +$987 |
| Dec 2025 | $425,861 | +$907 |
| Nov 2025 | $424,954 | +$579 |
| Oct 2025 | $424,375 | -$257 |
| Sep 2025 | $424,632 | -$964 |
| Aug 2025 | $425,596 | -$1,496 |
| Jul 2025 | $427,092 | -$1,801 |
| Jun 2025 | $428,893 | -$1,869 |
| May 2025 | $430,762 | -$2,048 |
| Apr 2025 | $432,810 | -$1,765 |
| Mar 2025 | $434,575 | — |
The pattern is clear: prices fell from March through October 2025, losing roughly $10,200 over seven months. Then the slide stopped. Since October, prices have crept up by about $3,300.
The monthly losses were steepest in May and June 2025, dropping nearly $2,000 per month. By fall, the bleeding slowed. The last four months have all been positive, though the gains are modest — under $1,000 per month.
This V-shaped recovery is shallow so far. Prices remain well below the March 2025 peak of $434,575.
Is Victorville a Good Place to Buy in 2026?
The data paints a mixed picture. Prices are down 1.6% year over year, but the monthly trend has been ticking upward since October 2025. You’re not catching a falling knife anymore — you’re watching a market try to stabilize.
The numbers that favor buyers: prices are off their peak by nearly $7,000, the year-over-year trend is negative, and renting is cheaper than owning in every ZIP code.
The numbers that favor patience: population growth at 4.5% is strong, monthly prices have been rising for four consecutive months, and the $410K–$445K range remains far below coastal California markets.
If you need to live in the High Desert and plan to stay five or more years, current prices offer a reasonable entry point. If you’re an investor chasing short-term appreciation, the data doesn’t support that bet yet.
Victorville Housing Market Outlook for 2026-2027
The four-month upward streak from October 2025 through February 2026 suggests the market has found a floor near $424,000. If the current pace of roughly $800–$1,000/month in gains continues, prices could recover to the $432,000–$435,000 range by late summer 2026.
But don’t expect a sharp rebound. The gains have been tiny compared to the losses earlier in 2025. The trend suggests a slow grind upward, not a bounce.
Population growth at 4.5% works in Victorville’s favor over a longer horizon. More residents mean more demand, which limits downside risk. The bigger question is whether mortgage rates cooperate — and that’s outside what this data can answer.
Similar Markets in CA
If you’re exploring options across California, here are some comparable cities:
- Bakersfield — Another affordable inland market with strong population growth at 3.0%.
- Fontana — A fellow Inland Empire city for buyers who want to stay closer to LA proper.
- Riverside — The metro area’s namesake city, typically priced higher than Victorville.
- Fresno — Central Valley alternative with a larger population base and similar affordability.
- Chula Vista — Near San Diego, for buyers willing to trade desert heat for coastal proximity.
Frequently Asked Questions
What is the average home price in Victorville?
The average home price in Victorville is $427,674 as of February 2026. Prices range from $410,401 in ZIP code 92395 to $445,386 in 92392. That $35,000 spread gives buyers options depending on budget.
Are home prices going up or down in Victorville?
Down year over year. Prices fell 1.6% compared to the same period last year, dropping from a March 2025 peak of $434,575. However, the monthly trend has been positive since October 2025, with prices climbing slowly for four consecutive months.
Is it cheaper to rent or buy in Victorville?
Renting is cheaper right now. The average rent across Victorville’s three ZIP codes is about $2,205/month. A mortgage on the median-priced home (with 20% down at 6.8%) runs roughly $2,230/month before taxes and insurance. Once you add those costs, owning is several hundred dollars more per month.
What is the most affordable neighborhood in Victorville?
ZIP code 92395 has the lowest median home price at $410,401 — about $17,000 below the city average. It also has the cheapest rent at $1,811/month, making it the most budget-friendly area in Victorville by both measures.
Methodology
Home values are based on the Zillow Home Value Index (ZHVI), a smoothed measure of typical home values in the 35th to 65th percentile range. Rent estimates use the Zillow Observed Rent Index (ZORI). Population figures come from the U.S. Census Bureau Population Estimates Program (2020-2024 vintage). All datasets are publicly available. Housing data updated 2026-02-28.