Rome GA Home Prices: $213K, Up 1.3% — 3 ZIPs Analyzed (2026)
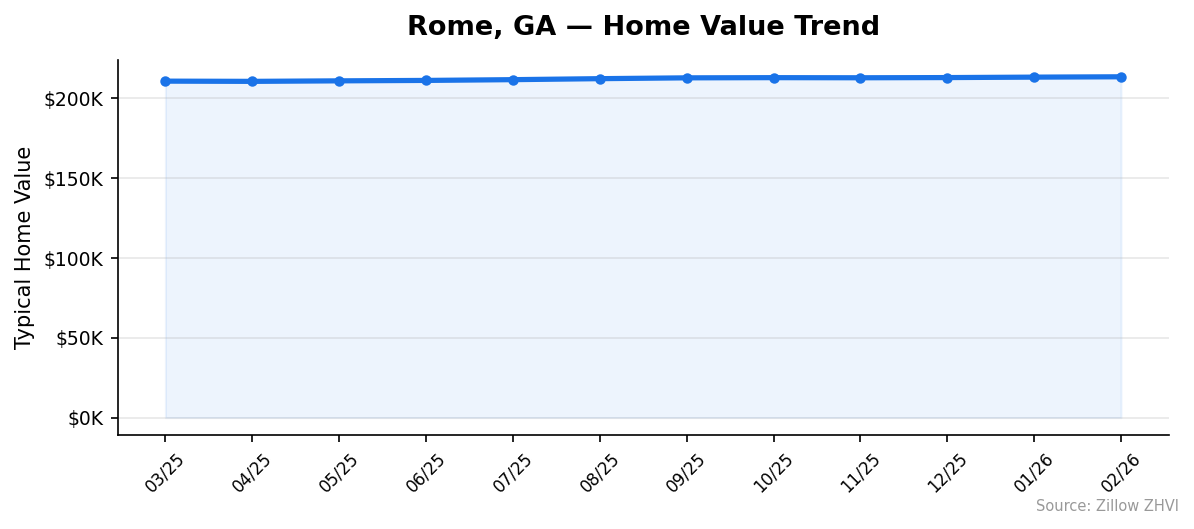
$213,334. That is what a typical home costs in Rome, GA as of February 2026. Prices are up 1.3% from a year ago, and the climb has been steady — every month since last spring has ticked slightly higher than the one before.
Quick answer: The average home price in Rome, GA is $213,334 as of February 2026, up 1.3% year over year according to Zillow.
Current Home Prices in Rome
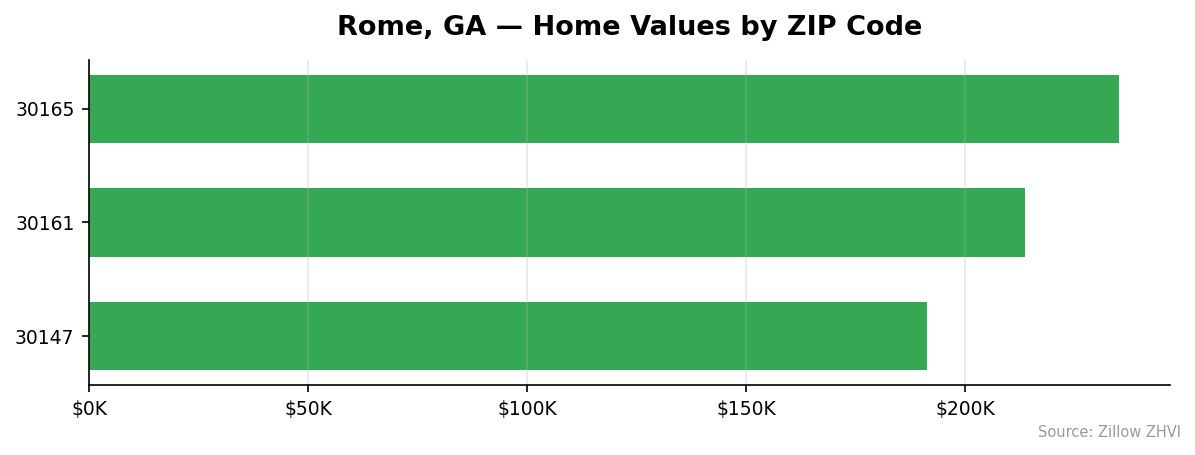
Rome sits well below the national median. The typical home across its three ZIP codes runs $213,334, with the cheapest neighborhood pricing homes at $191,351 and the most expensive pushing $235,062.
| Metric | Value |
|---|---|
| Median home value | $213,334 |
| Year-over-year change | +1.3% |
| Lowest ZIP average | $191,351 |
| Highest ZIP average | $235,062 |
| Price range (spread) | $43,711 |
| ZIP codes analyzed | 3 |
| Data month | February 2026 |
The spread between the cheapest and most expensive ZIP is about $43,700 — a 23% gap. That is narrow compared to larger metros where luxury pockets can double the median. Rome’s housing is clustered, not stratified.
A 1.3% annual gain is modest. Inflation typically runs higher, so in real terms prices are close to flat. That makes Rome an anomaly in Georgia, where metros closer to Atlanta have seen sharper movement in either direction.
For buyers, the practical read is this: you are not chasing a runaway market. You also are not catching a falling knife. Values have crept up for twelve straight months with no sign of a reversal.
Rome Home Prices by Neighborhood
Three ZIP codes cover Rome, and each tells a different story.
| ZIP Code | Average Home Value | Average Rent |
|---|---|---|
| 30165 | $235,062 | $1,165 |
| 30161 | $213,590 | $1,218 |
| 30147 | $191,351 | Data not available |
Most Expensive
- 30165 — $235,062. The priciest ZIP in Rome, running about 10% above the city average. Rent here is actually lower than in 30161, which hints at more owner-occupied housing stock.
- 30161 — $213,590. Sits almost exactly at the city median and has the highest rent of the three at $1,218. This is the core rental market.
- There are only three ZIPs, so no third tier exists.
Most Affordable
- 30147 — $191,351. The cheapest ZIP by a wide margin, about 10% under the city average. Rent data is not available for this ZIP.
- 30161 — $213,590. Middle of the pack. Affordable relative to 30165 but more expensive than 30147.
- Only three ZIPs exist, so this is the full range.
If you are shopping on price alone, 30147 is the pick. If you want rental income, 30161 has the strongest rent figure on record.
Rent vs Buy in Rome
Rent data is available for two of Rome’s three ZIPs. The average across them is about $1,192 a month.
| ZIP | Monthly Rent |
|---|---|
| 30161 | $1,218 |
| 30165 | $1,165 |
| 30147 | Data not available |
Run the buy math on a $213,334 home. With 20% down ($42,667) and a 30-year mortgage at roughly 7%, the principal and interest payment comes to about $1,135. Add property taxes (Georgia averages around 0.9%, so roughly $160/month) and insurance (call it $100/month), and you are at $1,395 before maintenance.
That puts owning about $200 a month more than renting at current rates. The math tilts toward renting in the short term — especially if you are not sure you will stay more than a few years. Closing costs and the opportunity cost of the down payment eat into any equity you would build.
For a buyer planning to stay five-plus years, the calculus flips. Prices have risen every month for a year, and even modest appreciation compounds against a fixed mortgage.
Population Growth and Migration
Rome is growing, just not fast. The city added 873 residents between 2020 and 2024 — a 2.3% gain over four years.
| Year | Population |
|---|---|
| 2020 | 37,874 |
| 2021 | 37,779 |
| 2022 | 38,164 |
| 2023 | 38,411 |
| 2024 | 38,747 |
Population dipped slightly in 2021 before turning around. Since then, growth has been consistent year over year.
Compared to other Georgia cities, Rome is on the slower end.
| City | 2024 Population | 4-Year Growth |
|---|---|---|
| Warner Robins | 86,199 | +7.0% |
| Atlanta | 520,070 | +4.0% |
| South Fulton | 112,003 | +3.5% |
| Rome | 38,747 | +2.3% |
| Athens-Clarke County | 128,691 | +1.1% |
| Savannah | 148,808 | +0.9% |
Warner Robins is growing three times faster. Atlanta nearly twice as fast. But Rome is still outpacing Savannah and Athens, and that matters for housing demand. Slow, steady growth keeps a floor under prices without the speculative spikes seen in hotter markets.
For sellers, that means predictable demand. For buyers, it means no urgency — inventory is not being snapped up in days.
Rome Housing Market Trends
Twelve months of data show a market moving in one direction: up, slowly.
| Month | Average Value |
|---|---|
| Feb 2026 | $213,334 |
| Jan 2026 | $213,120 |
| Dec 2025 | $212,843 |
| Nov 2025 | $212,723 |
| Oct 2025 | $212,793 |
| Sep 2025 | $212,675 |
| Aug 2025 | $212,159 |
| Jul 2025 | $211,538 |
| Jun 2025 | $211,061 |
| May 2025 | $210,792 |
| Apr 2025 | $210,471 |
| Mar 2025 | $210,611 |
The only month-over-month dip was October 2025, and it was a $118 decline — statistical noise. Every other month posted a gain.
Total appreciation over twelve months: $2,723, or 1.3%. That is a gentle slope, not a hockey stick. Rome’s market is neither overheating nor cooling.
The pace accelerated slightly in the second half of 2025. Between March and August 2025, prices rose $1,548. Between August 2025 and February 2026, they rose $1,175. So the rate of increase has slowed slightly, but remains positive.
Is Rome a Good Place to Buy in 2026?
The data points to a balanced market. Prices are rising but not sprinting. Inventory pressure is probably moderate given the steady 2.3% population growth. Nothing in the numbers suggests a bubble or a crash.
For a first-time buyer, Rome’s $213K median puts homeownership within reach for households earning $60-70K with a 20% down payment. That is rare in today’s housing market.
For an investor, the rent-to-price ratio in 30161 works out to roughly 0.57% monthly — below the 1% rule of thumb but not unusual for a slow-growth market.
For a move-up buyer, the narrow ZIP price spread ($43K from cheapest to priciest) limits your options but also protects against overpaying for a specific school district or neighborhood.
The case for buying: stable appreciation, affordable entry point, steady population growth. The case for waiting: rent is cheaper month-to-month, and the market is not running away from you.
Rome Housing Market Outlook for 2026-2027
The three-month trend shows prices rising about $214 per month on average (December 2025 to February 2026). If the current pace continues, Rome could see values climb another 1-1.5% over the next six months.
The longer twelve-month picture shows similar discipline: no month lost more than $120 of value, and no month gained more than $621. That kind of uniformity suggests a market anchored by local fundamentals rather than speculative flows.
The slight deceleration between the first and second half of the twelve-month window is worth watching. If it continues, annual appreciation could settle closer to 1% than 1.3% by mid-2026.
No data in the current trend suggests a price reversal. No data suggests a breakout either. Expect more of the same: slow, steady, boring — which is not a bad thing for buyers.
Similar Markets in GA
If Rome’s numbers work for you, these Georgia markets are worth a look:
- Columbus — another mid-sized Georgia city with comparable affordability.
- Augusta — similar population scale, different regional economy.
- Warner Robins — faster population growth, useful comparison for demand pressure.
- Savannah — larger city with slower growth but higher visibility.
- Atlanta — the metro anchor, priced far above Rome for context.
Frequently Asked Questions
What is the average home price in Rome?
The average home price in Rome, GA is $213,334 as of February 2026. That figure reflects the Zillow Home Value Index across the three ZIP codes that make up the city. The range runs from $191,351 in the cheapest ZIP to $235,062 in the most expensive.
Are home prices going up or down in Rome?
Prices are up 1.3% year over year. The climb has been consistent — every month from March 2025 to February 2026 posted a gain except one minor dip in October. Total appreciation over twelve months was $2,723.
Is it cheaper to rent or buy in Rome?
Renting is cheaper on a monthly basis. Average rent runs about $1,192 across the two ZIPs with data, while a typical mortgage on a $213K home with 20% down, taxes, and insurance lands around $1,395. Over five-plus years, buying likely wins as you build equity.
What is the most affordable neighborhood in Rome?
ZIP 30147 is the cheapest at $191,351, about 10% below the city average. Rent data is not available for 30147, so investor math cannot be calculated with current figures. Homebuyers looking for the lowest entry point should start here.
Methodology
Home values are based on the Zillow Home Value Index (ZHVI), a smoothed measure of typical home values in the 35th to 65th percentile range. Rent estimates use the Zillow Observed Rent Index (ZORI). Population figures come from the U.S. Census Bureau Population Estimates Program (2020-2024 vintage). All datasets are publicly available. Housing data updated 2026-02-28.