Highlands Ranch Home Prices: $699K, Down 2.8% — 3 ZIPs Analyzed (2026)
$699,330. That’s the typical home value in Highlands Ranch as of February 2026. Prices are down 2.8% from a year ago, and they’ve slipped every single month for the last 12 months.
Quick answer: The average home price in Highlands Ranch, CO is $699,330 as of February 2026, down 2.8% year over year according to Zillow.
Current Home Prices in Highlands Ranch
Highlands Ranch sits firmly in Denver’s southern suburban price tier. The current median lands just under $700K, but neighborhood values stretch from the high $600s to the mid $700s.
| Metric | Value |
|---|---|
| Median home value | $699,330 |
| Year-over-year change | -2.8% |
| Lowest ZIP median | $672,946 (80129) |
| Highest ZIP median | $741,824 (80126) |
| Spread between cheapest and priciest ZIP | $68,878 |
| ZIP codes tracked | 3 |
| Data through | February 2026 |
The 2.8% drop translates to roughly $20,000 wiped off the typical home over the past 12 months. That’s not a crash — it’s a steady slide. For context, the price gap between the cheapest and priciest ZIP is more than three times larger than the annual loss, which means where you buy in Highlands Ranch matters more than when.
You won’t find a bargain here in absolute terms. Even the cheapest neighborhood clears $670K. But the downward trend has narrowed the premium between Highlands Ranch and lower-priced Denver suburbs. Buyers who walked away last spring expecting a bigger correction are now watching prices flatten out instead of falling further.
Highlands Ranch Home Prices by Neighborhood
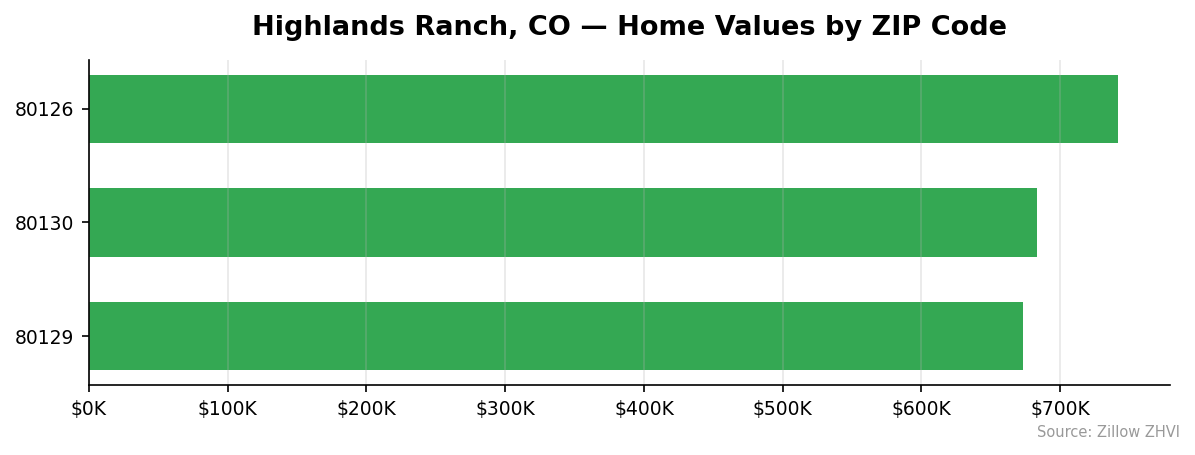
Three ZIP codes cover Highlands Ranch, and all three sit within $69K of each other. There are no extreme outliers — pricing here is unusually compressed for a Denver-area community.
| ZIP Code | Median Home Value | Median Rent | Rent-to-Price Ratio |
|---|---|---|---|
| 80126 | $741,824 | $2,884 | 0.39% |
| 80130 | $683,219 | $2,487 | 0.36% |
| 80129 | $672,946 | $2,122 | 0.32% |
Most Expensive
- 80126 — $741,824. The priciest ZIP in town, sitting about $42K above the city average. Rent here also runs the highest at $2,884 a month, suggesting consistent demand at the top end.
- 80130 — $683,219. Mid-pack pricing, about $16K below the city median. Rent of $2,487 places it in the middle as well.
- 80129 — $672,946. Technically the third-priciest only because there are three ZIPs. See below.
Most Affordable
- 80129 — $672,946. The cheapest entry point, roughly $26K below the city average and $69K cheaper than 80126. Rent is also the lowest at $2,122.
- 80130 — $683,219. A modest $10K premium over 80129 with $365 more in monthly rent.
- 80126 — $741,824. The most expensive of the three by a clear margin.
Rent vs Buy in Highlands Ranch
Average rent across the three ZIPs comes to about $2,498 a month. Compare that to the cost of buying.
A $699,330 home with 20% down ($139,866) leaves a $559,464 mortgage. At a 7% 30-year fixed rate, principal and interest alone runs about $3,722 a month. Add property taxes, insurance, and HOA dues — common in Highlands Ranch — and you’re looking at $4,400 to $4,700 a month.
| Scenario | Monthly Cost |
|---|---|
| Average rent (3-ZIP mean) | ~$2,498 |
| Mortgage P&I only (20% down, 7%) | ~$3,722 |
| Estimated total cost of ownership | $4,400 – $4,700 |
| Monthly gap (buy vs rent) | ~$1,900 – $2,200 |
Renting is cheaper by roughly $2,000 a month. That’s $24,000 a year you’d need to recoup through appreciation or principal paydown. With prices down 2.8% over the last year, appreciation is currently working against buyers. Principal paydown in year one of a $559K loan at 7% is only about $5,700.
The math favors renters right now. That can change quickly if rates drop or prices stop falling — but neither is happening in this data.
Highlands Ranch Housing Market Trends
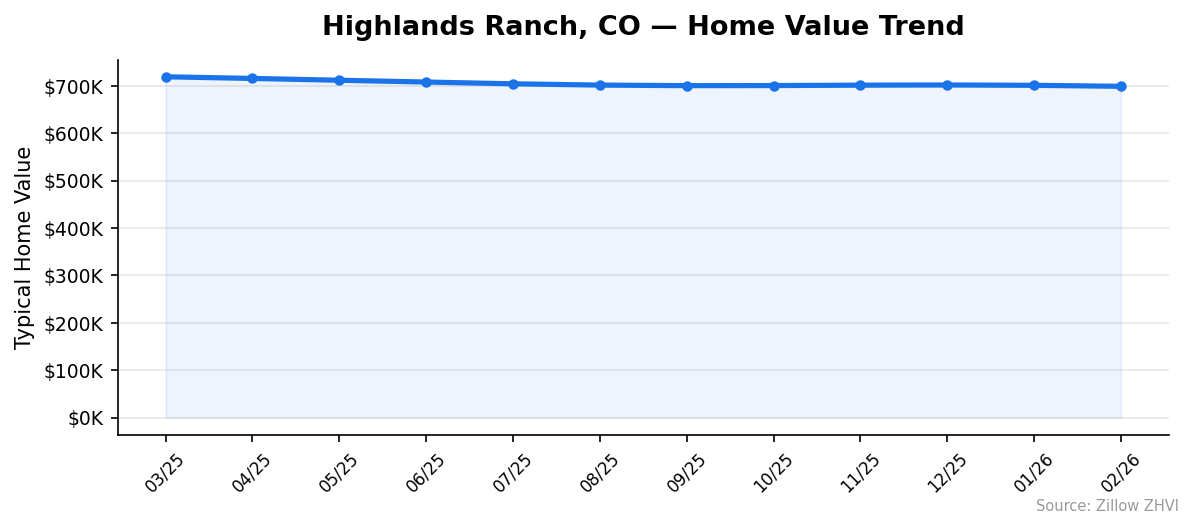
The 12-month trend is a straight line down. Every single month in the past year has come in lower than the one before, with one tiny exception in October.
| Month | Median Value | Change vs Prior Month |
|---|---|---|
| Mar 2025 | $719,445 | — |
| Apr 2025 | $715,982 | -0.5% |
| May 2025 | $712,156 | -0.5% |
| Jun 2025 | $708,347 | -0.5% |
| Jul 2025 | $704,647 | -0.5% |
| Aug 2025 | $701,920 | -0.4% |
| Sep 2025 | $700,735 | -0.2% |
| Oct 2025 | $700,927 | +0.0% |
| Nov 2025 | $701,759 | +0.1% |
| Dec 2025 | $702,125 | +0.1% |
| Jan 2026 | $701,429 | -0.1% |
| Feb 2026 | $699,330 | -0.3% |
Notice the pattern. The biggest monthly drops happened in spring and early summer 2025 — half a percent each month. By fall, the slide had slowed to a near-stop, with three months of flat-to-slightly-positive movement. Then the decline resumed in January and accelerated in February.
The total move from peak to current is about $20,115, or 2.8%. Not a freefall, but a market that hasn’t found a bottom yet.
Is Highlands Ranch a Good Place to Buy in 2026?
The data points to a buyer’s market — but not a great one for buyers either.
Prices are falling, which gives buyers room to negotiate. Sellers who listed at last year’s prices are accepting cuts. The 12-month chart shows no sign of a reversal: the small bounce in late 2025 already faded.
The flip side: median values still sit near $700K. Even with a 2.8% discount versus a year ago, monthly carrying costs of $4,400+ price out a lot of households. Renting saves roughly $2,000 a month right now, and that gap won’t close unless prices drop significantly more or rents jump.
If you need to buy — relocating for work, growing family, locked into the area — the current market gives you negotiating room you didn’t have two years ago. If you’re flexible, waiting another six months costs you nothing in this trend.
Highlands Ranch Housing Market Outlook for 2026-2027
The 3-month trend tells the most useful story. From December 2025 to February 2026, prices fell from $702,125 to $699,330 — a $2,795 drop, or about 0.4%. Annualized, that pace works out to roughly a 1.6% decline.
If the current pace continues, Highlands Ranch median values would dip into the high $680s by mid-2026 and approach $680K by year-end. That assumes no change in mortgage rates or buyer demand.
Two factors could break the pattern. A meaningful drop in mortgage rates would pull buyers back in and likely halt the slide. A worsening labor market in Denver metro would push the decline faster. The data here doesn’t predict which way that breaks — it only shows that, as of February 2026, the trend is still pointed down.
Similar Markets in CO
- Littleton — Highlands Ranch’s closest neighbor, often compared on schools and price tier.
- Centennial — Another south Denver suburb with similar buyer demographics.
- Aurora — Buyers priced out of Highlands Ranch frequently look here for more affordable options.
- Denver — The metro anchor, useful for benchmarking how the suburbs are tracking against the urban core.
- Lakewood — A west-side alternative at a different price point.
Frequently Asked Questions
What is the average home price in Highlands Ranch?
The average home value in Highlands Ranch, CO is $699,330 as of February 2026. That figure is the average across three ZIP codes — 80126, 80129, and 80130 — based on the Zillow Home Value Index.
Are home prices going up or down in Highlands Ranch?
Down. Values are off 2.8% year over year, sliding from $719,445 in March 2025 to $699,330 in February 2026. The decline has been steady — every month of the last 12 has come in flat or lower than the prior month.
Is it cheaper to rent or buy in Highlands Ranch?
Renting is cheaper by roughly $2,000 a month. The average rent across the three ZIPs is about $2,498, while a typical mortgage with 20% down at current rates runs $4,400 to $4,700 a month including taxes, insurance, and HOA dues.
What is the most affordable neighborhood in Highlands Ranch?
ZIP 80129 has the lowest median home value at $672,946 — about $26K below the city average. It also has the lowest rent at $2,122 a month, making it the most affordable choice on both sides of the rent-versus-buy decision.
Methodology
Home values are based on the Zillow Home Value Index (ZHVI), a smoothed measure of typical home values in the 35th to 65th percentile range. Rent estimates use the Zillow Observed Rent Index (ZORI). Population figures come from the U.S. Census Bureau Population Estimates Program (2020-2024 vintage). All datasets are publicly available. Housing data updated 2026-02-28.