Littleton Home Prices: $629K, Down 2.6% — 4 ZIPs Analyzed (2026)
$628,722. That’s what a typical home costs in Littleton, CO as of February 2026. Prices are down 2.6% from a year ago, and the monthly data shows the slide has been steady rather than sudden.
Quick answer: The average home price in Littleton, CO is $628,722 as of February 2026, down 2.6% year over year according to Zillow.
Current Home Prices in Littleton
The typical Littleton home sits at $628,722. That number reflects the middle tier of the market across four ZIP codes in the city.
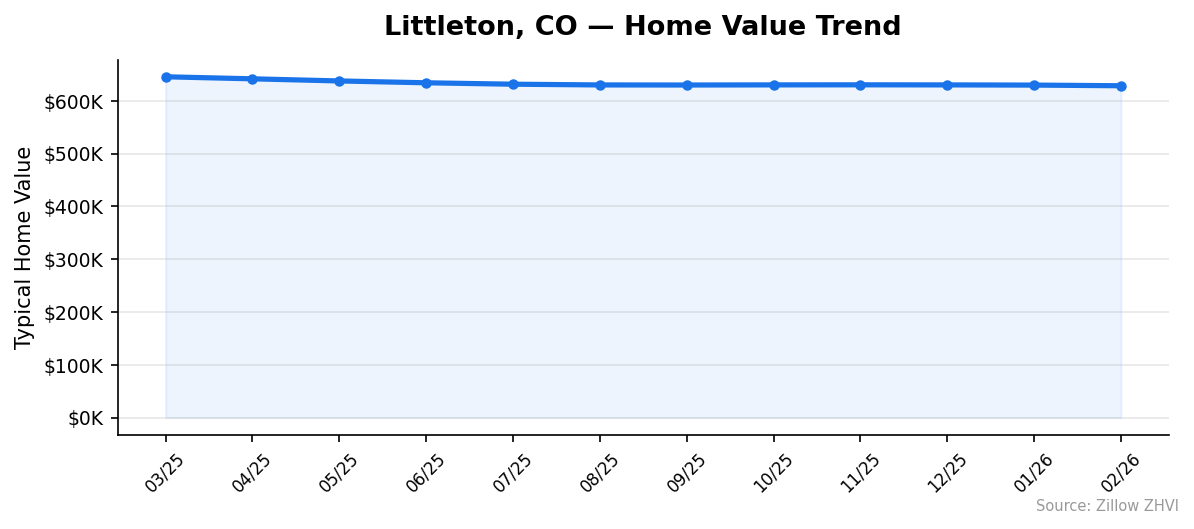
A year ago, the same index read closer to $645,694. Since then, values have drifted lower almost every month. The peak in this dataset was March 2025. February 2026 is the low.
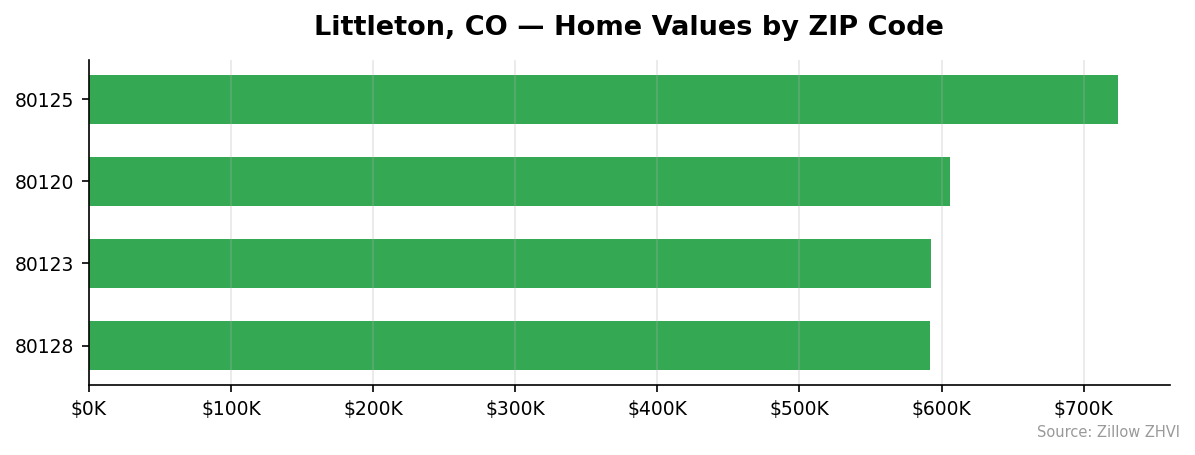
The spread between Littleton’s cheapest and priciest ZIPs is wide. The lowest ZIP sits at $592,102. The highest is $724,379. That’s a $132,277 gap within a single city of roughly 45,000 people.
| Metric | Value |
|---|---|
| Median home value (Feb 2026) | $628,722 |
| Year-over-year change | -2.6% |
| Lowest ZIP value | $592,102 |
| Highest ZIP value | $724,379 |
| Price spread (max - min) | $132,277 |
| ZIP codes analyzed | 4 |
| Metro area | Denver-Aurora-Lakewood |
You’re looking at a market that is softening, not crashing. A 2.6% annual decline on a $628K home works out to roughly $16,900 in lost value. That matters to sellers who bought at the 2025 peak. It matters less to buyers with a 30-year horizon.
Littleton sits inside the Denver-Aurora-Lakewood metro. The city’s price level runs above the metro median for most submarkets, reflecting its older housing stock, established schools, and proximity to the foothills.
Littleton Home Prices by Neighborhood
Four ZIPs make up the Littleton market in this dataset. Three cluster near $600K. One stands apart.
| ZIP Code | Home Value | Monthly Rent (ZORI) |
|---|---|---|
| 80128 | $592,102 | $2,054 |
| 80123 | $592,604 | $1,894 |
| 80120 | $605,804 | $1,737 |
| 80125 | $724,379 | $2,300 |
Most Expensive
80125 — $724,379. This ZIP runs $95,657 above the city median and also commands the highest rent at $2,300. It covers the southwestern edge of the Littleton area near newer construction and lower density.
80120 — $605,804. Central Littleton, close to downtown and the light rail. Home values are near the city average, but rents here are the lowest of the four ZIPs at $1,737.
80123 — $592,604. A near tie for the cheapest ZIP, but rent demand is stronger than 80120, with ZORI at $1,894.
Most Affordable
80128 — $592,102. The city’s lowest price tag, yet rents here are the second-highest at $2,054. That rent-to-price ratio makes 80128 the strongest candidate for buy-to-rent math in the city.
80123 — $592,604. Just $502 above 80128. Rent is a bit lower, so for owner-occupiers this one tracks slightly better on monthly cost.
80120 — $605,804. Third-cheapest and the only ZIP under $1,800 in rent. Good for renters, less useful for landlords.
Rent vs Buy in Littleton
Rents across Littleton’s four ZIPs average about $1,996 per month. The range runs from $1,737 in 80120 to $2,300 in 80125.
Now the buy side. On a $628,722 home with 20% down, you’re financing roughly $502,978. At a 7% 30-year rate, principal and interest alone run about $3,346 a month. Add property taxes, insurance, and HOA fees, and the all-in monthly cost lands near $4,200.
| Scenario | Monthly Cost |
|---|---|
| Average rent (4 ZIPs) | $1,996 |
| Cheapest rent (80120) | $1,737 |
| Most expensive rent (80125) | $2,300 |
| Buy (median home, 20% down, 7%) | ~$4,200 |
Renting costs less than half of buying on a month-to-month basis. That gap has widened as prices fell 2.6% but rates stayed high.
The math flips for long-term owners. Mortgage payments build equity. Rent does not. If you plan to stay five years or longer, buying typically catches up, especially if rates drop and refinancing becomes an option.
For a short-term stay or an uncertain job situation, the numbers favor renting.
Population Growth and Migration
Littleton had 44,879 residents in 2024. That’s down from 45,598 in 2020 — a 1.6% decline over four years. The city is shrinking while most of Colorado grows.
| Year | Population |
|---|---|
| 2020 | 45,598 |
| 2021 | 45,337 |
| 2022 | 44,819 |
| 2023 | 44,732 |
| 2024 | 44,879 |
The trend bottomed in 2023 and ticked up slightly in 2024, but the city has not recovered to 2020 levels. This is unusual for a Denver-area suburb.
Compare that to nearby cities:
| City | 2024 Population | 4-Year Growth |
|---|---|---|
| Greeley | 114,363 | +4.6% |
| Aurora | 403,130 | +4.2% |
| Thornton | 146,689 | +3.2% |
| Colorado Springs | 493,554 | +2.5% |
| Denver | 729,019 | +1.6% |
| Littleton | 44,879 | -1.6% |
Every comparison city added people. Littleton lost them. The gap between Littleton (-1.6%) and the slowest-growing peer, Denver (+1.6%), is 3.2 percentage points.
What does this mean for housing? Shrinking populations usually mean softer demand. That aligns with the 2.6% price decline you’re seeing in the ZHVI data. Supply is not being absorbed as quickly as in Aurora or Thornton.
If that population uptick in 2024 holds into 2025 and 2026, the price trajectory could stabilize. If it doesn’t, the downward drift likely continues.
Littleton Housing Market Trends
Twelve months of data tell a clear story: down, every month, with one small pause.
| Month | Median Value | Low ZIP | High ZIP |
|---|---|---|---|
| Mar 2025 | $645,694 | $606,515 | $749,417 |
| Apr 2025 | $641,844 | $602,630 | $745,214 |
| May 2025 | $637,800 | $598,967 | $740,107 |
| Jun 2025 | $634,332 | $596,096 | $734,945 |
| Jul 2025 | $631,640 | $594,181 | $730,421 |
| Aug 2025 | $630,260 | $593,661 | $727,295 |
| Sep 2025 | $630,102 | $593,976 | $725,915 |
| Oct 2025 | $630,351 | $594,438 | $725,682 |
| Nov 2025 | $630,471 | $594,698 | $725,827 |
| Dec 2025 | $630,319 | $594,585 | $726,003 |
| Jan 2026 | $629,961 | $593,933 | $725,764 |
| Feb 2026 | $628,722 | $592,102 | $724,379 |
Prices peaked at $645,694 in March 2025 and have fallen every month since. Total decline over twelve months: $16,972, or 2.6%.
The sharpest drops came early — April through July 2025 shaved off $10,000+. Since August, monthly moves have been small. The floor looks like it may be forming near $628K-$630K.
The high-end ZIP followed the same path. 80125 peaked at $749,417 and sits at $724,379 now — down $25,038, or 3.3%. The low end moved less in dollars but more in percentage terms.
Is Littleton a Good Place to Buy in 2026?
It depends on what you’re optimizing for.
If you want a falling knife, keep waiting — but the pace has clearly slowed. From August 2025 to February 2026, the median moved just $1,538 on a $628K home. That’s 0.2% over six months. The bottom may be close.
If you want a stable entry point in the Denver metro without paying Denver prices, Littleton offers that. You get a $629K median instead of Denver’s higher benchmarks, with the same light rail access.
This is a buyer’s market by the numbers. Population is flat to down. Prices are falling. Inventory is not being absorbed at Aurora or Thornton speeds. Sellers have less bargaining power than they did in 2024.
Watch the rent side. ZORI readings of $1,700-$2,300 mean renting is genuinely cheaper than buying today. That keeps demand soft until rates drop or prices fall further.
Littleton Housing Market Outlook for 2026-2027
The 3-month trend suggests prices are stabilizing. From December 2025 to February 2026, the median fell just $1,597 — less than 0.3%. The steep drops of mid-2025 are over.
If the current pace continues, Littleton could finish 2026 close to where it started. A slight decline or a flat year is more likely than another 2-3% drop, based on the momentum visible in the monthly data.
Two things could push prices lower: continued population decline, and mortgage rates holding above 7%. Two things could stop the slide: the 2024 population uptick continuing, and any rate cuts that bring buyers back.
The high-end ZIP 80125 has been more volatile than the three ZIPs clustered near $600K. Expect that gap to widen or narrow based on the higher end’s rate sensitivity.
These are directional signals from the trend, not forecasts of specific numbers.
Similar Markets in CO
- Centennial — neighboring suburb, similar price tier to Littleton’s mid-range ZIPs.
- Highlands Ranch — comparable suburban profile just south, worth checking against Littleton’s 80125.
- Lakewood — west-side Denver suburb with similar metro access at a different price point.
- Denver — the core city; compare metro premium against Littleton’s suburban discount.
- Aurora — the growth comparison. Aurora gained 4.2% in population while Littleton lost 1.6%.
Frequently Asked Questions
What is the average home price in Littleton?
The average home price in Littleton is $628,722 as of February 2026. That figure is the median across four ZIP codes — 80120, 80123, 80125, and 80128 — using the Zillow Home Value Index.
Are home prices going up or down in Littleton?
Down. Littleton prices have fallen 2.6% year over year, dropping from $645,694 in March 2025 to $628,722 in February 2026. The decline has happened in small monthly steps, and the pace slowed noticeably after August 2025.
Is it cheaper to rent or buy in Littleton?
Renting. The average rent across Littleton’s four ZIPs runs about $1,996 a month. A mortgage on the $628,722 median home with 20% down at 7% runs roughly $3,346 in principal and interest alone, with all-in monthly costs closer to $4,200.
What is the most affordable neighborhood in Littleton?
ZIP 80128 at $592,102. ZIP 80123 is nearly identical at $592,604. Both sit about $36,000 below the city median and well under half the price of the priciest ZIP, 80125, at $724,379.
Methodology
Home values are based on the Zillow Home Value Index (ZHVI), a smoothed measure of typical home values in the 35th to 65th percentile range. Rent estimates use the Zillow Observed Rent Index (ZORI). Population figures come from the U.S. Census Bureau Population Estimates Program (2020-2024 vintage). All datasets are publicly available. Housing data updated 2026-02-28.