Pueblo Home Prices: $268K, Down 0.8% — 8 ZIPs Analyzed (2026)
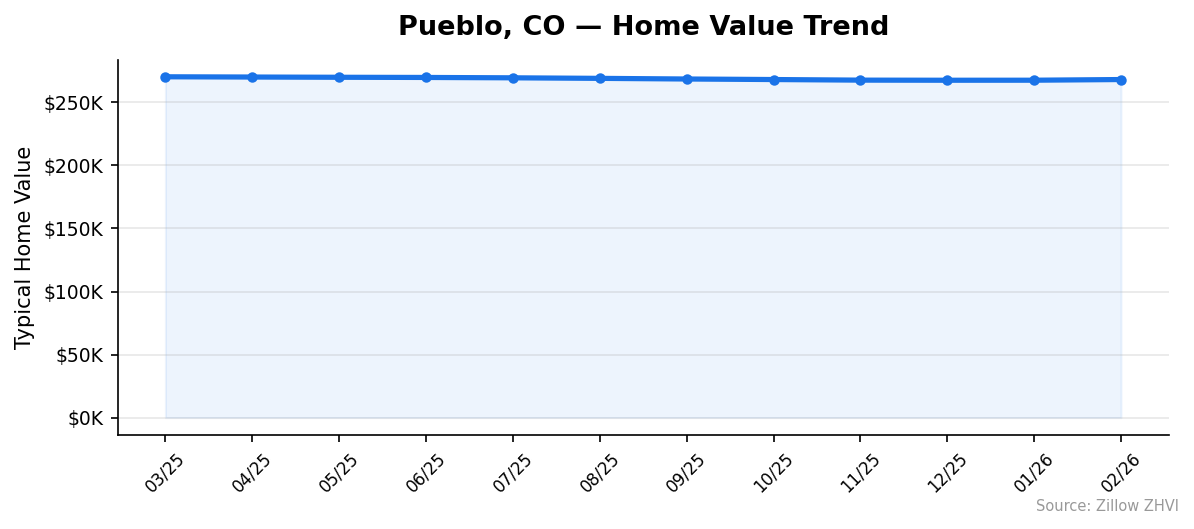
$268,172. That’s the typical home value in Pueblo as of February 2026, down 0.8% from a year ago. Prices have fallen every single month since March 2025.
Quick answer: The average home price in Pueblo, CO is $268,172 as of February 2026, down 0.8% year over year according to Zillow.
Current Home Prices in Pueblo
Pueblo sits well below Colorado’s expensive Front Range markets. The median home value across the city’s 8 ZIP codes is $268,172. That number reflects the typical home in the 35th to 65th percentile range, not the listing price you’ll see on Zillow.
The 12-month drop is modest. Prices fell about $2,100 over the past year, less than 1% in total. But the direction matters. Pueblo has been declining for 11 straight months.
| Metric | Value |
|---|---|
| Median home value | $268,172 |
| Year-over-year change | -0.8% |
| Cheapest ZIP | $194,848 |
| Most expensive ZIP | $396,246 |
| ZIP codes tracked | 8 |
| Data through | February 2026 |
The price spread is wide. The gap between the cheapest and priciest ZIP is roughly $201,000 — meaning a buyer’s location choice matters as much as their budget in this market.
For context, the statewide median in Colorado runs well over $500K. Pueblo offers nearly half-off pricing compared to Denver-area metros. The tradeoff shows up in population trends and local economic momentum, both of which we’ll cover below.
What you should take from this section: Pueblo is one of the most affordable cities in Colorado by a meaningful margin. The market is soft but not crashing. A buyer entering today is paying roughly the same price someone paid in spring 2025.
Pueblo Home Prices by Neighborhood
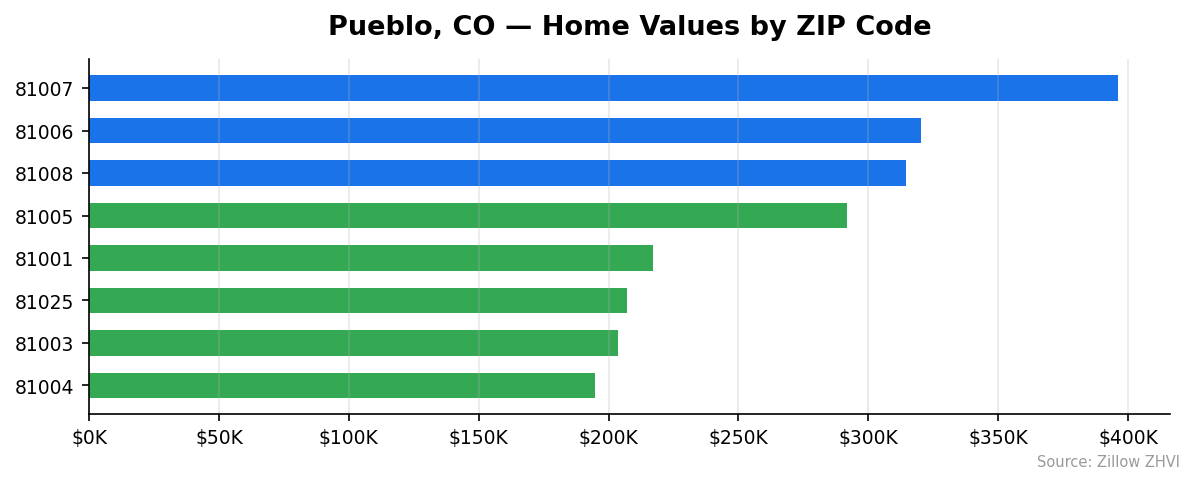
The 8 ZIP codes in Pueblo split into three clear tiers. West-side suburban ZIPs lead. Older inner-city ZIPs anchor the bottom.
| ZIP Code | Median Value | vs City Avg |
|---|---|---|
| 81007 | $396,246 | +47.8% |
| 81006 | $320,332 | +19.4% |
| 81008 | $314,353 | +17.2% |
| 81005 | $291,941 | +8.9% |
| 81001 | $217,138 | -19.0% |
| 81025 | $207,005 | -22.8% |
| 81003 | $203,509 | -24.1% |
| 81004 | $194,848 | -27.3% |
Most Expensive
81007 — $396,246. The Pueblo West area commands the highest prices in the metro, 48% above the city average, with rents averaging $1,753 monthly.
81006 — $320,332. East-side ZIP running about $52,000 above the city median.
81008 — $314,353. Northern Pueblo, third-most-expensive at 17% above average, with rents around $1,683.
Most Affordable
81004 — $194,848. The cheapest ZIP in Pueblo, 27% below the city average, with rents averaging $1,229 — the lowest entry point into the market.
81003 — $203,509. Downtown Pueblo, second-cheapest at 24% below average, with rents at $1,278.
81025 — $207,005. Slightly outside the urban core but still 23% under the city median.
Rent vs Buy in Pueblo
Rents in Pueblo span a tighter range than home prices. The cheapest ZIP rents for $1,201; the most expensive runs $1,753. That’s a $552 gap, compared to a $201,000 gap in home values.
| ZIP | Average Rent |
|---|---|
| 81007 | $1,753 |
| 81008 | $1,683 |
| 81005 | $1,608 |
| 81003 | $1,278 |
| 81004 | $1,229 |
| 81001 | $1,201 |
Run the buy math on a typical $268,172 home. With 10% down ($26,817), a 30-year mortgage at current rates of roughly 6.8%, and adding property tax and insurance, you’re looking at $1,800 to $2,000 a month. The citywide rent average across reported ZIPs is approximately $1,459.
Renting wins by $350 to $550 a month at the median. The gap narrows in the cheaper ZIPs and widens in 81007 and 81008, where rents are high but ownership costs are higher still.
There’s a wrinkle. With prices falling 0.8% annually, buyers aren’t getting the appreciation cushion that justified premium ownership costs in 2021-2022. Equity build through principal paydown is the main wealth play here, not price growth.
Renting makes sense if you’re under three years. Buying makes sense if you’ll stay five-plus years and want to lock in a payment.
Population Growth and Migration
Pueblo is losing residents. Slowly, but consistently.
| Year | Population |
|---|---|
| 2020 | 111,910 |
| 2021 | 112,006 |
| 2022 | 111,428 |
| 2023 | 111,295 |
| 2024 | 111,166 |
The city peaked at 112,006 in 2021 and has shrunk every year since. The four-year change is -0.7% — a net loss of 744 residents. That’s not a collapse, but it’s a stark contrast to the rest of Colorado.
| City | 2024 Population | 4-Year Growth |
|---|---|---|
| Aurora | 403,130 | +4.2% |
| Greeley | 114,363 | +4.6% |
| Thornton | 146,689 | +3.2% |
| Colorado Springs | 493,554 | +2.5% |
| Denver | 729,019 | +1.6% |
| Pueblo | 111,166 | -0.7% |
Every comparison city is growing. Pueblo is the outlier. This explains why prices here lag the rest of the state — softer demand from migration means less competitive bidding and slower appreciation. For buyers, this is the source of Pueblo’s affordability. For sellers, it means longer days on market and less room to push back on price.
Pueblo Housing Market Trends
The 12-month trend tells a consistent story. Down, slightly, every month.
| Month | Median Value |
|---|---|
| Mar 2025 | $270,351 |
| Apr 2025 | $270,156 |
| May 2025 | $269,966 |
| Jun 2025 | $269,825 |
| Jul 2025 | $269,535 |
| Aug 2025 | $269,103 |
| Sep 2025 | $268,594 |
| Oct 2025 | $268,170 |
| Nov 2025 | $267,697 |
| Dec 2025 | $267,611 |
| Jan 2026 | $267,636 |
| Feb 2026 | $268,172 |
The pattern is unusual. Eleven consecutive months of declines, then a small uptick in February 2026 — the first positive month since March 2025. February gained $536 over January.
One month doesn’t make a trend. But it does suggest the cooling may be hitting a floor. The total drop from peak (March 2025) to trough (December 2025) was about $2,740 — less than 1.1%. This is a gentle drift, not a correction.
The maximum-value ZIP held more stable than the minimum-value ZIP. The cheapest ZIP fell from $197,799 to $194,848 (-1.5%), while the priciest fell from $402,766 to $396,246 (-1.6%). The decline has been broad, not concentrated in one tier.
Is Pueblo a Good Place to Buy in 2026?
It’s a buyer’s market by the numbers. Prices have fallen 11 of the last 12 months. Population is declining. Inventory pressure is on sellers, not buyers.
The case for buying in Pueblo right now:
- Entry-level homes available under $200K in 81004, 81003, and 81025
- Rent-to-price ratios that work for landlords (a $1,229 rent on a $194,848 home = 7.6% gross yield)
- No bidding war pressure — sellers are negotiating
The case for waiting:
- Negative momentum on both prices and population
- February’s $536 uptick is too small to call a bottom
- Colorado’s growing metros offer better long-term appreciation potential
If you need a primary residence and plan to stay 5+ years, Pueblo offers Colorado’s cheapest entry. If you’re investing for appreciation, look at Aurora, Greeley, or Colorado Springs instead — they have the population growth Pueblo lacks.
Pueblo Housing Market Outlook for 2026-2027
The 3-month trend (December through February) shows prices essentially flat: $267,611 → $267,636 → $268,172. That’s a small upward drift after nearly a year of declines.
If the current pace continues, Pueblo will end 2026 within 1-2% of current values — either a slow recovery to $272K-$274K or continued drift around $266K-$268K. The data does not support a sharp move in either direction.
Population trends are the wild card. Four straight years of decline rarely reverse without a specific catalyst (major employer move-in, infrastructure investment, regional migration shift). Absent that, demand pressure stays muted.
Watch the cheapest ZIPs for the clearest signal. 81004 below $190,000 would suggest further softening. A move above $200,000 would suggest the floor has held.
Similar Markets in CO
- Colorado Springs — Pueblo’s larger northern neighbor with growing population and higher prices.
- Denver — The state’s flagship market, several times Pueblo’s price point.
- Aurora — Faster-growing metro for buyers prioritizing appreciation over affordability.
- Fort Collins — College-town alternative with a stronger jobs base.
- Thornton — Denver-area suburb showing 3.2% population growth.
Frequently Asked Questions
What is the average home price in Pueblo?
The average home price in Pueblo, CO is $268,172 as of February 2026. That figure is the Zillow Home Value Index — the typical home in the 35th to 65th percentile range across all 8 of Pueblo’s ZIP codes.
Are home prices going up or down in Pueblo?
Down. Prices fell 0.8% over the past year, dropping from $270,351 in March 2025 to $268,172 in February 2026. The decline ran for 11 consecutive months before a small $536 uptick in February.
Is it cheaper to rent or buy in Pueblo?
Renting is cheaper short-term. The average rent across reported ZIPs is roughly $1,459, while a mortgage on a typical $268,172 home runs $1,800-$2,000 monthly with 10% down. Buying makes more sense if you’ll stay five-plus years.
What is the most affordable neighborhood in Pueblo?
ZIP 81004 is the cheapest at $194,848 — 27% below the city average. It’s followed by 81003 at $203,509 and 81025 at $207,005. All three are under $210K, well below the citywide median.
Methodology
Home values are based on the Zillow Home Value Index (ZHVI), a smoothed measure of typical home values in the 35th to 65th percentile range. Rent estimates use the Zillow Observed Rent Index (ZORI). Population figures come from the U.S. Census Bureau Population Estimates Program (2020-2024 vintage). All datasets are publicly available. Housing data updated 2026-02-28.