Las Vegas Home Prices: $445K, Down 1.8% — 44 ZIPs Analyzed (2026)
$444,749. That’s what a typical home costs in Las Vegas right now. Prices are sliding — down 1.8% from a year ago — and the decline has been consistent month after month. If you’re watching this market, the numbers tell a clear story.
Quick answer: The average home price in Las Vegas, NV is $444,749 as of February 2026, down 1.8% year over year according to Zillow.
Current Home Prices in Las Vegas
| Metric | Value |
|---|---|
| Median Home Value | $444,749 |
| Year-over-Year Change | -1.8% |
| Lowest ZIP Value | $266,200 |
| Highest ZIP Value | $1,002,791 |
| ZIP Codes Tracked | 44 |
| Data as of | February 2026 |
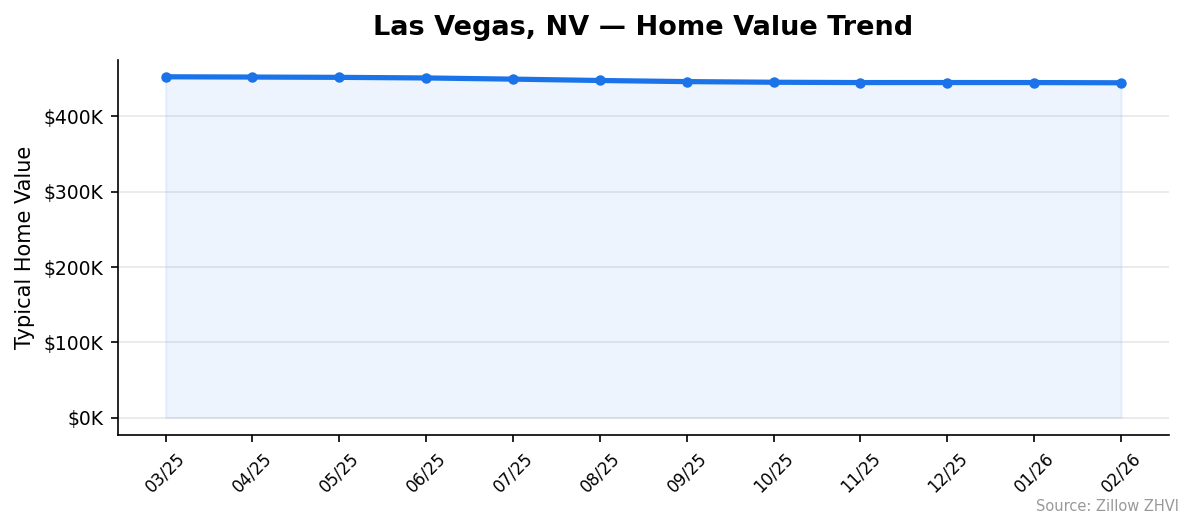
The median home in Las Vegas has lost about $8,000 in value over the past 12 months. That’s not a crash. It’s a slow grind downward — roughly $670 per month.
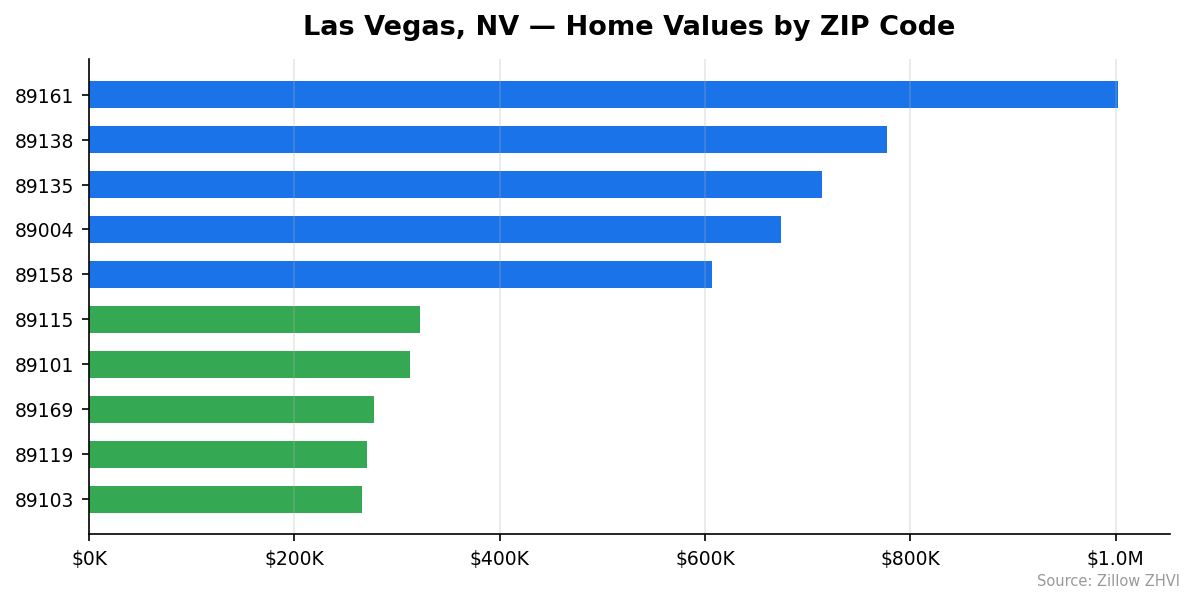
The spread between the cheapest and most expensive ZIP codes is enormous. You can find a home valued around $266K in one part of town and $1 million in another. That $736K gap means “Las Vegas real estate” is really several different markets stacked on top of each other.
A year ago, in March 2025, the citywide median sat at $452,703. The decline accelerated slightly through summer and fall before leveling off in the last few months. From December 2025 to February 2026, prices barely moved — dropping just $324. The market may be finding a floor.
Las Vegas Home Prices by Neighborhood
| ZIP Code | Typical Home Value | Typical Rent |
|---|---|---|
| 89004 | $673,842 | — |
| 89101 | $312,977 | $1,152 |
| 89102 | $371,687 | $1,317 |
| 89103 | $266,200 | $1,402 |
| 89104 | $356,028 | $1,380 |
| 89106 | $333,991 | $1,685 |
| 89107 | $344,978 | $1,483 |
| 89108 | $355,228 | $1,391 |
| 89109 | $378,227 | $2,932 |
| 89110 | $354,394 | $1,417 |
| 89113 | $477,394 | $1,884 |
| 89115 | $322,402 | $1,336 |
| 89117 | $477,632 | $1,590 |
| 89118 | $331,118 | $1,506 |
| 89119 | $270,277 | $1,399 |
| 89120 | $406,881 | $1,510 |
| 89121 | $350,790 | $1,342 |
| 89122 | $352,558 | $1,650 |
| 89123 | $435,284 | $1,732 |
| 89128 | $384,390 | $1,578 |
| 89129 | $440,878 | $1,753 |
| 89130 | $440,312 | $1,948 |
| 89131 | $537,285 | $2,075 |
| 89134 | $491,238 | $2,216 |
| 89135 | $714,468 | $2,425 |
| 89138 | $777,679 | $2,818 |
| 89139 | $463,847 | $1,922 |
| 89141 | $525,611 | $2,001 |
| 89142 | $360,809 | $1,637 |
| 89143 | $468,221 | $2,242 |
| 89144 | $521,117 | $2,087 |
| 89145 | $383,904 | $1,810 |
| 89146 | $396,492 | $1,501 |
| 89147 | $412,098 | $1,737 |
| 89148 | $472,805 | $1,912 |
| 89149 | $496,499 | $1,850 |
| 89156 | $356,413 | $1,566 |
| 89158 | $607,330 | $4,238 |
| 89161 | $1,002,791 | — |
| 89166 | $498,935 | $2,002 |
| 89169 | $277,411 | $1,355 |
| 89178 | $478,726 | $2,036 |
| 89179 | $476,163 | $2,292 |
| 89183 | $411,631 | $1,804 |
Most Expensive Neighborhoods
89161 leads the city at $1,002,791 — more than double the citywide median and the only ZIP code in Las Vegas that crosses the million-dollar mark.
89138 comes in at $777,679 with rents averaging $2,818/month, making it one of the priciest areas to both own and rent in the metro.
89135 rounds out the top three at $714,468 with typical rents of $2,425/month — about 60% above the citywide median home value.
Most Affordable Neighborhoods
89103 is the cheapest ZIP in Las Vegas at $266,200, roughly 40% below the city median. Rents here run $1,402/month — one of the lower figures in the city but not the lowest.
89119 sits at $270,277 with rents of $1,399/month. At this price point, you’re paying about $175K less than the typical Las Vegas home.
89169 comes in at $277,411, making it the third most affordable ZIP. Rents here average $1,355/month.
Rent vs Buy in Las Vegas
The typical rent across Las Vegas ZIP codes runs about $1,735/month. How does that stack up against buying?
Take the median home at $444,749. Put 20% down ($88,950) and finance the rest at 7%. Your monthly principal and interest payment comes to roughly $2,367. Add property taxes — Nevada has no state income tax, but Clark County property taxes run about 0.55% — and you’re looking at another $204/month. Toss in insurance around $150/month.
| Monthly Cost | Amount |
|---|---|
| Typical Rent | $1,735 |
| Mortgage (P&I) | $2,367 |
| Property Tax | $204 |
| Insurance | ~$150 |
| Total Ownership | ~$2,721 |
| Difference | $986/month |
Buying costs about $986 more per month than renting right now. That’s $11,832 per year in extra cash out the door.
Of course, part of your mortgage payment builds equity. At 7%, roughly $290 of your first payment goes toward principal. But the gap is still wide. Renters keep almost $1,000/month in flexibility.
The rent-to-price ratio tells the same story. At $1,735 rent on a $444,749 home, the annual rent is about 4.7% of the home price. The traditional 5% threshold suggests renting is the better financial deal here — though just barely.
ZIP code 89109 is a standout. Home values sit at $378,227 but rents average $2,932/month — the second-highest in the city. That’s a 9.3% rent-to-price ratio, which would favor buying if you plan to stay put. On the other end, 89161 has $1 million homes but no rent data available.
Population Growth and Migration
Las Vegas added 31,159 residents between 2020 and 2024. The city’s population grew from 647,763 to 678,922 — a 4.8% increase over four years.
| Year | Population |
|---|---|
| 2020 | 647,763 |
| 2021 | 651,868 |
| 2022 | 656,716 |
| 2023 | 666,630 |
| 2024 | 678,922 |
Growth accelerated in 2023 and 2024. The city added roughly 4,000 people per year in 2021-2022, then nearly 10,000 in 2023 and over 12,000 in 2024. That uptick matters for housing demand.
How does Las Vegas compare to other Nevada cities?
| City | Population (2024) | Growth (2020-2024) |
|---|---|---|
| Las Vegas | 678,922 | +4.8% |
| Henderson | 350,039 | +9.8% |
| North Las Vegas | 294,034 | +12.6% |
| Reno | 281,714 | +6.3% |
| Sparks | 111,520 | +2.4% |
| Carson City | 58,148 | -0.9% |
North Las Vegas is growing nearly three times faster than Las Vegas proper. Henderson is growing at double the rate. Both are absorbing spillover demand from the main city. Carson City is the only Nevada city in this group losing population.
More people means more demand for housing. But with prices actually falling 1.8% year over year, supply appears to be keeping pace — at least for now. The question is whether 12,000+ new residents per year eventually tips the balance back toward rising prices.
Las Vegas Housing Market Trends
Here’s how the median home value has moved month by month over the past year:
| Month | Median Value | Change from Prior Month |
|---|---|---|
| Mar 2025 | $452,703 | — |
| Apr 2025 | $452,355 | -$348 |
| May 2025 | $451,958 | -$397 |
| Jun 2025 | $451,151 | -$807 |
| Jul 2025 | $449,596 | -$1,555 |
| Aug 2025 | $447,787 | -$1,809 |
| Sep 2025 | $446,309 | -$1,478 |
| Oct 2025 | $445,455 | -$854 |
| Nov 2025 | $445,033 | -$422 |
| Dec 2025 | $445,073 | +$40 |
| Jan 2026 | $445,033 | -$40 |
| Feb 2026 | $444,749 | -$284 |
The sharpest drops happened mid-year. July and August 2025 saw the biggest monthly declines — $1,555 and $1,809 respectively. After that, the pace of decline slowed sharply.
December 2025 was the one month that showed any price increase, gaining $40. That barely counts. But combined with the tiny moves in November, January, and February, it suggests the decline is running out of momentum.
Over the full 12-month window, prices dropped $7,954 — from $452,703 to $444,749. That’s a 1.8% decline. Not dramatic, but persistent.
Is Las Vegas a Good Place to Buy in 2026?
The data leans toward a buyer-friendly market. Prices are down 1.8% year over year. They’ve declined for 11 of the past 12 months. Sellers have less pricing power than they did a year ago.
With 44 ZIP codes spanning $266K to $1 million, there’s a wide range of entry points. A buyer with a $350K budget has at least 15 ZIP codes to choose from. Someone stretching to $500K has access to about 30 neighborhoods.
Population growth adds a long-term floor under demand. The city is adding 12,000+ residents per year. Those people need to live somewhere. That doesn’t mean prices shoot up tomorrow, but it does limit how far they can fall.
The rent-vs-buy math currently favors renting by about $986/month. If you’re not sure how long you’ll stay, renting makes more financial sense in the short term. Buying works better if you’re looking at a 5+ year hold, especially if prices stabilize and rates eventually come down.
For buyers who’ve been priced out in recent years, this is the most accessible the Las Vegas market has been since the post-pandemic run-up.
Las Vegas Housing Market Outlook for 2026-2027
The 12-month trend shows consistent price declines, but the rate is slowing. From July-August 2025’s drops of $1,500-1,800/month, the market has decelerated to moves of just $40-$284/month in the last quarter.
If the current pace continues — losses of $100-$300/month — expect the median to drift toward $440,000 to $443,000 by mid-2026. That would represent another 0.5-1.0% decline from today’s level.
The three-month trend suggests prices are approaching a plateau. December’s tiny increase and the minimal declines since then point to a market that’s more flat than falling. A stabilization in the $440K-$445K range over the next 3-6 months is the most likely scenario based on the available data.
Population growth of 12,000+ residents per year could start pushing prices upward again if new construction doesn’t keep pace. But right now, the data doesn’t show a rebound forming — just a slowdown in the decline.
Similar Markets in NV
If you’re exploring the Las Vegas metro or comparing options across Nevada, here are other markets to consider:
- Henderson — The second-largest city in the metro, growing 9.8% since 2020. Buyers looking for a suburban alternative to Las Vegas often end up here.
- North Las Vegas — Growing at 12.6%, the fastest rate in the state. Typically offers lower price points than Las Vegas proper.
- Reno — Northern Nevada’s largest city, growing 6.3%. A different climate and economy than Las Vegas, with its own pricing dynamics.
- Sparks — Adjacent to Reno with slower growth at 2.4%. Often a more affordable entry into the northern Nevada market.
- Carson City — The state capital, and the only city in this group losing population (-0.9%). A much smaller, quieter market.
Frequently Asked Questions
What is the average home price in Las Vegas?
The average home price in Las Vegas is $444,749 as of February 2026. This is the citywide median based on the Zillow Home Value Index, which tracks typical home values in the 35th to 65th percentile range. Individual neighborhoods range from $266,200 to over $1 million.
Are home prices going up or down in Las Vegas?
Prices are going down. The median home value dropped 1.8% year over year, falling from $452,703 in March 2025 to $444,749 in February 2026. The decline has been consistent — prices fell in 11 of the last 12 months — though the pace has slowed significantly since late 2025.
Is it cheaper to rent or buy in Las Vegas?
Renting is cheaper right now. A typical monthly rent runs about $1,735, while total homeownership costs on a median-priced home come to roughly $2,721/month (assuming 20% down, 7% rate). That’s a gap of about $986/month in favor of renting.
What is the most affordable neighborhood in Las Vegas?
ZIP code 89103 is the most affordable at $266,200 — about 40% below the citywide median. ZIP codes 89119 ($270,277) and 89169 ($277,411) are also well below average. All three have rents in the $1,355-$1,402 range.
Methodology
Home values are based on the Zillow Home Value Index (ZHVI), a smoothed measure of typical home values in the 35th to 65th percentile range. Rent estimates use the Zillow Observed Rent Index (ZORI). Population figures come from the U.S. Census Bureau Population Estimates Program (2020-2024 vintage). All datasets are publicly available. Housing data updated 2026-02-28.