Richmond Home Prices: $610K, Down 5.1% — 5 ZIPs Analyzed (2026)
$610,183. That’s what a typical home in Richmond, California costs right now — and it’s falling fast. Prices are down 5.1% compared to a year ago, one of the sharper declines in the Bay Area. Across 5 ZIP codes, values range from $509K to $721K.
Quick answer: The average home price in Richmond, CA is $610,183 as of February 2026, down 5.1% year over year according to Zillow.
Current Home Prices in Richmond
Richmond sits in the San Francisco-Oakland-Berkeley metro, where even a correction leaves prices well above national averages. Here’s the snapshot:
| Metric | Value |
|---|---|
| Median Home Value | $610,183 |
| Year-over-Year Change | -5.1% |
| Lowest ZIP Value | $509,221 |
| Highest ZIP Value | $721,443 |
| ZIP Codes Tracked | 5 |
| Data as of | February 2026 |
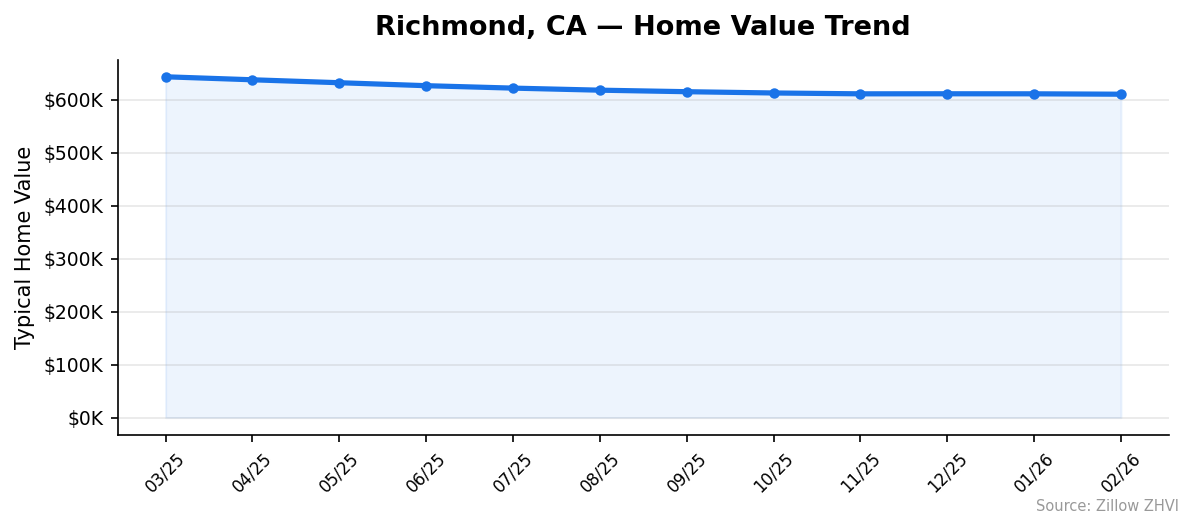
That 5.1% drop translates to roughly $33,000 in lost value over 12 months. For a homeowner who bought at the peak, the numbers sting. For buyers sitting on the sidelines, the math is starting to shift.
Richmond’s decline outpaces many Bay Area neighbors. The city hit its recent peak around March 2025 when the average hovered near $643K. Since then, values have slid every single month. February 2026 marked the lowest reading in the 12-month window at $610,183.
The spread between the cheapest and most expensive ZIP codes is $212,222 — a gap that shows Richmond is not one market but several.
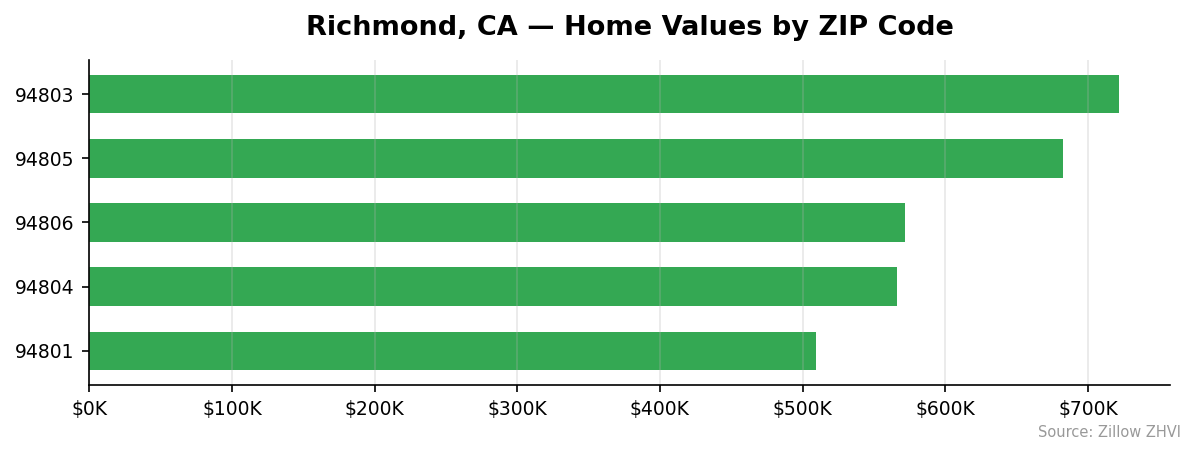
Richmond Home Prices by Neighborhood
Five ZIP codes cover Richmond. The price gap between the priciest and most affordable is over $200K.
| ZIP Code | Typical Home Value | Average Rent |
|---|---|---|
| 94803 | $721,443 | $2,745/mo |
| 94805 | $682,557 | $2,238/mo |
| 94806 | $571,816 | $2,292/mo |
| 94804 | $565,880 | $2,699/mo |
| 94801 | $509,221 | $2,184/mo |
Most Expensive
94803 leads at $721,443 — nearly 18% above the city median, with the highest rents to match at $2,745/month. 94805 follows at $682,557, though its rents are surprisingly moderate at $2,238/month, making it a relative value for buyers in the upper tier.
Most Affordable
94801 is Richmond’s entry point at $509,221, roughly $101K below the city average, with the lowest rents at $2,184/month. 94804 comes in at $565,880 but carries notably high rents at $2,699/month — a mismatch that could signal strong rental demand in that area. 94806 sits in between at $571,816 with moderate rents of $2,292/month.
Rent vs Buy in Richmond
Rent data is available for all five Richmond ZIP codes. The city-wide average rent runs about $2,432/month.
| ZIP Code | Avg Rent/Month | Home Value | Price-to-Rent Ratio |
|---|---|---|---|
| 94801 | $2,184 | $509,221 | 19.4 |
| 94804 | $2,699 | $565,880 | 17.5 |
| 94805 | $2,238 | $682,557 | 25.4 |
| 94806 | $2,292 | $571,816 | 20.8 |
| 94803 | $2,745 | $721,443 | 21.9 |
A rough mortgage estimate on a $610K home — assuming 20% down, a 6.5% rate on a 30-year fixed — puts the monthly payment around $3,085 before property taxes and insurance. Add those in and you’re looking at $3,500 to $4,000/month.
Compare that to the average rent of $2,432. Renting saves you roughly $1,000-$1,500 per month in cash flow. With prices still falling, there’s no urgency to buy for appreciation alone. But if you plan to stay 7+ years and can handle the payments, the gap narrows with each year of fixed mortgage costs versus rising rents.
ZIP 94804 stands out: rents are high relative to home values, giving it the lowest price-to-rent ratio at 17.5. That’s the closest to a buy-favoring number in Richmond.
Population Growth and Migration
Richmond is slowly losing residents. The city’s population dropped from 116,177 in 2020 to 115,353 in 2024 — a decline of 0.7% over four years.
| Year | Population |
|---|---|
| 2020 | 116,177 |
| 2021 | 115,745 |
| 2022 | 115,291 |
| 2023 | 114,865 |
| 2024 | 115,353 |
The trend reversed slightly in 2024, when Richmond added about 488 residents after three consecutive years of decline. It’s too early to call that a turnaround, but the bleeding may have slowed.
Compared to other California cities, Richmond’s story is familiar — slower growth in the Bay Area while inland and Southern California cities expand faster.
| City | 2024 Population | 4-Year Growth |
|---|---|---|
| Bakersfield | 417,468 | +3.0% |
| Sacramento | 535,798 | +1.9% |
| San Diego | 1,404,452 | +1.4% |
| Fresno | 550,105 | +1.4% |
| Oakland | 443,554 | +0.6% |
| Richmond | 115,353 | -0.7% |
A shrinking population puts downward pressure on housing demand. Fewer people competing for homes means less urgency for sellers — one factor behind the 5.1% price drop.
Richmond Housing Market Trends
Here’s how prices moved month by month over the past year:
| Month | Average Value | Low ZIP | High ZIP |
|---|---|---|---|
| Mar 2025 | $643,049 | $537,497 | $762,217 |
| Apr 2025 | $637,395 | $533,721 | $754,873 |
| May 2025 | $631,857 | $529,606 | $748,133 |
| Jun 2025 | $626,260 | $525,395 | $741,370 |
| Jul 2025 | $621,680 | $521,418 | $735,550 |
| Aug 2025 | $617,785 | $518,122 | $730,204 |
| Sep 2025 | $614,914 | $516,086 | $725,929 |
| Oct 2025 | $612,497 | $514,870 | $721,974 |
| Nov 2025 | $610,904 | $513,593 | $720,109 |
| Dec 2025 | $610,993 | $512,104 | $720,799 |
| Jan 2026 | $610,918 | $510,393 | $721,979 |
| Feb 2026 | $610,183 | $509,221 | $721,443 |
Twelve straight months of decline. The pace was steepest in spring 2025 — values dropped about $5,000-$6,000 per month between March and July. Then the decline slowed considerably. From October 2025 to February 2026, the average moved less than $2,500 total.
The floor may be forming. Month-over-month losses shrank from $5,654 in April to just $735 in February. The cheapest ZIP (94801) dropped from $537K to $509K — a $28K slide. The priciest ZIP (94803) fell from $762K to $721K, losing $41K.
Is Richmond a Good Place to Buy in 2026?
The data points to a buyer’s market. Prices are falling, population is flat, and the monthly declines are getting smaller — suggesting you won’t catch a dramatically lower price by waiting much longer.
Richmond’s position in the Bay Area metro gives it a structural floor. You’re 15 minutes from Berkeley, 20 from Oakland, and connected to San Francisco by BART. A $610K median is a steep discount compared to those neighbors.
The rent-vs-buy math still favors renting for short-term stays. But if you’re planning to put down roots, buying now at 5.1% below last year’s prices — with the decline clearly decelerating — is a stronger position than buyers have had in years.
Watch the cheapest ZIPs. At $509K, 94801 offers Bay Area proximity at a relative discount. If you can tolerate the tradeoffs of a transitioning neighborhood, the entry price is hard to match this close to San Francisco.
Richmond Housing Market Outlook for 2026-2027
The 12-month trend shows a clear pattern: steep drops that flatten into a slow glide. From March to August 2025, values fell an average of $5,053/month. From September 2025 to February 2026, the average monthly loss shrank to $948.
If the current pace continues, Richmond’s median could settle in the $600K-$605K range by mid-2026. The flattening curve suggests the rapid correction phase is over.
The biggest wildcard is interest rates. Richmond’s price declines coincided with elevated mortgage rates. Any rate cuts could bring sidelined buyers back into the market and stabilize or even lift prices. Conversely, if rates stay high and the Bay Area tech sector softens further, the slow bleed could continue into 2027.
Similar Markets in CA
If you’re shopping in Richmond, these California cities are worth comparing:
- Los Angeles — A much larger market with its own pricing pressures, useful as a statewide benchmark.
- Oakland — Richmond’s closest neighbor and metro anchor, typically priced higher but trending similarly.
- Long Beach — Southern California alternative with port-city character and different price dynamics.
- Riverside — Inland Empire option for buyers who want more space per dollar.
- Bakersfield — California’s most affordable mid-size city, growing at 3.0% while Richmond shrinks.
Frequently Asked Questions
What is the average home price in Richmond?
The average home price in Richmond, CA is $610,183 as of February 2026. Prices range from $509,221 in ZIP code 94801 to $721,443 in ZIP code 94803. The city-wide median sits well below neighboring Berkeley and Oakland.
Are home prices going up or down in Richmond?
Prices are going down. Richmond’s median fell 5.1% year over year, dropping from roughly $643K in March 2025 to $610K in February 2026. The decline has slowed in recent months — the last three months saw less than $1,000 in combined losses.
Is it cheaper to rent or buy in Richmond?
Renting is cheaper on a monthly basis. The average rent across Richmond’s ZIP codes is about $2,432/month. A mortgage on a median-priced home (20% down, 6.5% rate) runs approximately $3,085/month before taxes and insurance. That’s a gap of at least $650/month, and likely more after you factor in property taxes, insurance, and maintenance.
What is the most affordable neighborhood in Richmond?
ZIP code 94801 is the most affordable at $509,221 for a typical home. It also has the lowest average rent at $2,184/month. That’s roughly $101K below the city-wide median and $212K less than the priciest ZIP (94803).
Methodology
Home values are based on the Zillow Home Value Index (ZHVI), a smoothed measure of typical home values in the 35th to 65th percentile range. Rent estimates use the Zillow Observed Rent Index (ZORI). Population figures come from the U.S. Census Bureau Population Estimates Program (2020-2024 vintage). All datasets are publicly available. Housing data updated 2026-02-28.