Oakland Home Prices: $767K, Down 7.1% — 12 ZIPs Analyzed (2026)
$767K. That’s what a typical home costs in Oakland right now — and it’s falling fast.
The median home value in Oakland, CA sits at $766,688 as of February 2026. That’s a 7.1% drop from a year ago, with prices sliding every month for nearly a year straight. Across 12 ZIP codes, values range from $443K to $1.55 million.
Quick answer: The average home price in Oakland, CA is $766,688 as of February 2026, down 7.1% year over year according to Zillow.
Current Home Prices in Oakland
Here’s where Oakland stands right now:
| Metric | Value |
|---|---|
| Median Home Value | $766,688 |
| Year-over-Year Change | -7.1% |
| Lowest ZIP Value | $442,765 (94621) |
| Highest ZIP Value | $1,553,740 (94618) |
| Number of ZIPs Tracked | 12 |
| Data As Of | February 2026 |
That 7.1% annual decline translates to roughly $59,000 in lost home equity for the typical Oakland homeowner. The gap between the cheapest and most expensive ZIP codes is over $1.1 million, which tells you Oakland is not one market — it’s a dozen very different ones stacked on top of each other.
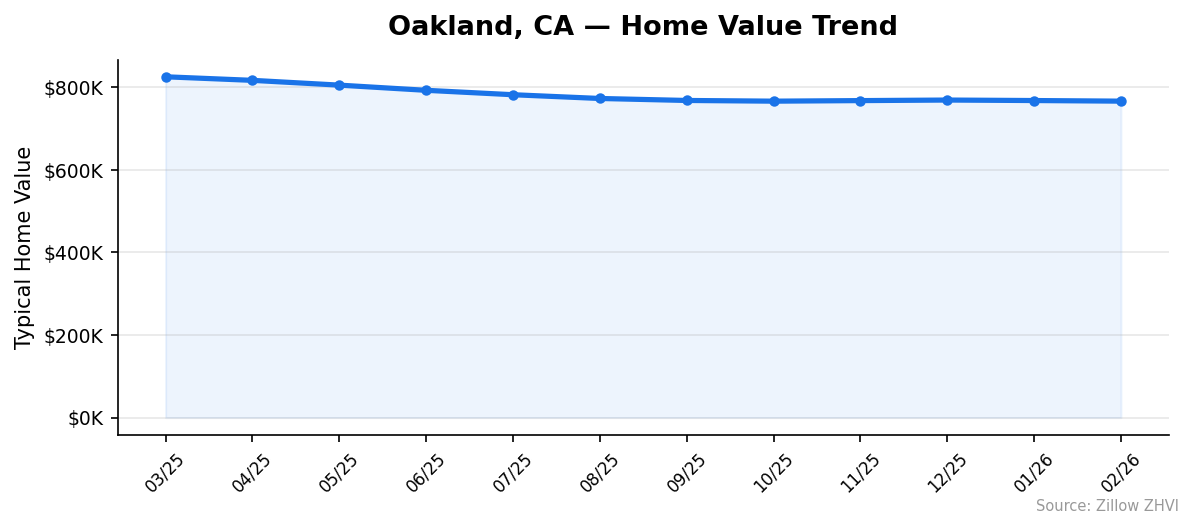
The price drop puts Oakland in correction territory. After peaking above $825K in early 2025, the city has given back gains steadily. February’s $766,688 reading is the lowest in the 12-month data window.
Buyers who were priced out a year ago might find more room to negotiate. Sellers who waited for a rebound are still waiting.
Oakland Home Prices by Neighborhood
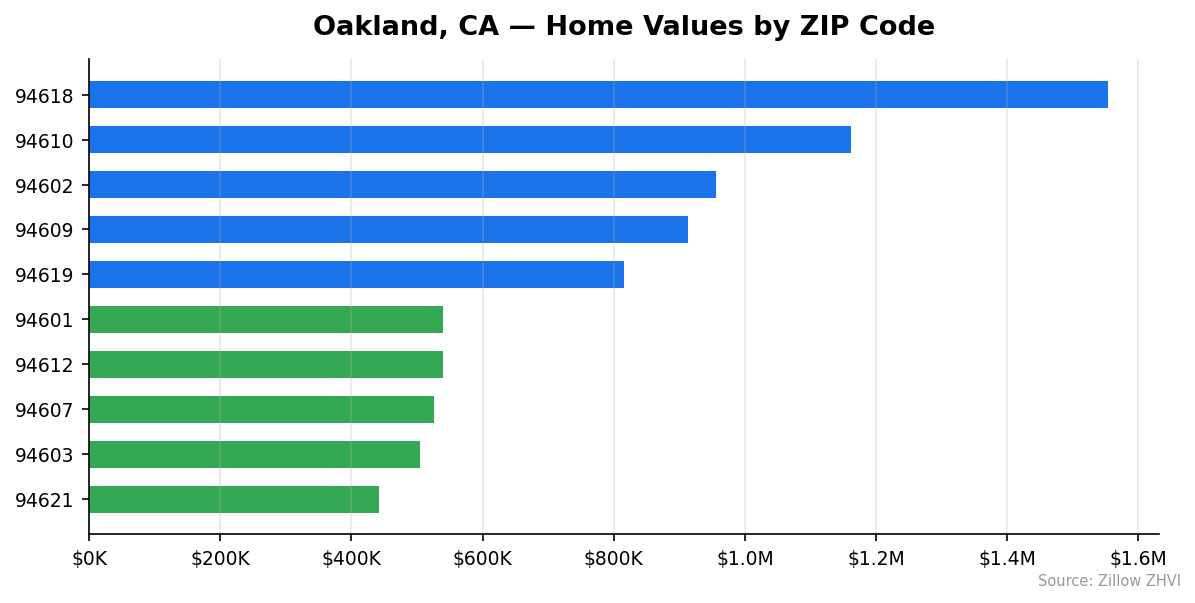
Prices vary enormously across Oakland’s 12 tracked ZIP codes. Here’s the full breakdown:
| ZIP Code | Typical Home Value | Typical Monthly Rent |
|---|---|---|
| 94618 | $1,553,740 | $2,781 |
| 94610 | $1,162,398 | $2,205 |
| 94602 | $956,283 | $2,744 |
| 94609 | $912,935 | $2,745 |
| 94619 | $816,076 | Data not available |
| 94605 | $650,076 | $2,312 |
| 94606 | $595,918 | $2,378 |
| 94601 | $540,354 | $1,841 |
| 94612 | $539,150 | $2,687 |
| 94607 | $525,332 | $2,542 |
| 94603 | $505,225 | $2,429 |
| 94621 | $442,765 | $2,472 |
Most Expensive ZIPs
94618 leads Oakland at $1,553,740 — more than double the city median, with rents at $2,781/month. 94610 comes in at $1,162,398, a premium area where rents are actually below average at $2,205/month. 94602 rounds out the top three at $956,283, with rents among the highest in the city at $2,744/month.
Most Affordable ZIPs
94621 is Oakland’s entry point at $442,765, 42% below the city average, though rents there run $2,472/month. 94603 comes in at $505,225 with $2,429/month rent. 94607 offers homes at $525,332, but its $2,542/month rent is above the city average — a sign of strong rental demand relative to ownership costs.
Rent vs Buy in Oakland
The math favors renters right now.
Across Oakland’s 11 ZIPs with rent data, the typical monthly rent averages about $2,467. Now compare that to buying. A median-priced home at $766,688 with 20% down means a $613,350 mortgage. At current rates near 7%, your monthly principal and interest alone runs approximately $4,080. Add property taxes, insurance, and maintenance, and you’re looking at $5,000 or more per month.
That’s roughly double the cost of renting.
| Cost | Monthly Amount |
|---|---|
| Average Rent (ZORI) | ~$2,467 |
| Mortgage P&I (20% down, ~7%) | ~$4,080 |
| Estimated Total Ownership Cost | ~$5,000+ |
One interesting wrinkle: ZIP 94621 has the lowest home values ($442,765) but charges $2,472/month in rent. Meanwhile, 94610 has homes worth $1,162,398 but rents of just $2,205. The price-to-rent ratio is wildly uneven across Oakland’s neighborhoods.
If you’re weighing the decision, the declining prices add another layer. Buying into a falling market means your equity could shrink further before it stabilizes.
Population Growth and Migration
Oakland’s population has been on a slow comeback.
The city counted 443,554 residents in 2024, up 0.6% from 440,983 in 2020. But the path wasn’t straight — Oakland lost population in 2021 and 2022 before rebounding in 2023 and 2024.
| Year | Population |
|---|---|
| 2020 | 440,983 |
| 2021 | 436,836 |
| 2022 | 436,544 |
| 2023 | 439,455 |
| 2024 | 443,554 |
The 2021-2022 dip likely reflects the pandemic-era exodus from the Bay Area. The recovery since then shows Oakland is pulling people back, just slowly.
Compared to other large California cities, Oakland’s 0.6% growth over four years is modest:
| City | 2024 Population | 4-Year Growth |
|---|---|---|
| Bakersfield | 417,468 | 3.0% |
| Sacramento | 535,798 | 1.9% |
| San Diego | 1,404,452 | 1.4% |
| Fresno | 550,105 | 1.4% |
| Stockton | 324,975 | 1.2% |
| Oakland | 443,554 | 0.6% |
Oakland is growing the slowest in this group. Slower population growth means less demand pressure on housing, which aligns with the price declines you’re seeing. Inland California cities like Bakersfield and Fresno are growing much faster, likely absorbing some of the people priced out of the Bay Area.
Oakland Housing Market Trends
Oakland prices have declined for 10 of the last 12 months. Here’s the full picture:
| Month | Average Value | Lowest ZIP | Highest ZIP |
|---|---|---|---|
| Feb 2026 | $766,688 | $442,765 | $1,553,740 |
| Jan 2026 | $768,166 | $446,337 | $1,552,162 |
| Dec 2025 | $769,347 | $449,795 | $1,549,465 |
| Nov 2025 | $767,994 | $452,130 | $1,539,887 |
| Oct 2025 | $766,646 | $454,627 | $1,527,655 |
| Sep 2025 | $768,343 | $457,885 | $1,520,617 |
| Aug 2025 | $773,151 | $461,813 | $1,518,400 |
| Jul 2025 | $782,241 | $467,598 | $1,526,343 |
| Jun 2025 | $792,943 | $473,948 | $1,538,649 |
| May 2025 | $805,495 | $480,950 | $1,558,526 |
| Apr 2025 | $817,073 | $487,617 | $1,576,686 |
| Mar 2025 | $825,704 | $492,749 | $1,589,211 |
The average value dropped from $825,704 in March 2025 to $766,688 in February 2026 — a decline of $59,016 or 7.1%.
Something interesting is happening at the extremes. The cheapest ZIP fell from $492,749 to $442,765, a drop of about $50,000. But the most expensive ZIP only fell from $1,589,211 to $1,553,740 — a $35,471 decline. In percentage terms, the bottom of the market is falling faster than the top.
The pace of decline has slowed in recent months. From January to February, the average dropped just $1,478. Compare that to $13,000+ monthly drops in the summer of 2025. The market may be approaching a floor.
Is Oakland a Good Place to Buy in 2026?
The data points to a buyer’s market.
Prices are down 7.1% year over year. The decline has been steady and broad-based across all 12 ZIP codes. Renting is substantially cheaper than owning on a monthly basis. And population growth is sluggish compared to the rest of California.
For buyers, the question is timing. Prices are still falling, but the rate of decline has slowed dramatically. The month-over-month changes from October through February are tiny — less than $2,000 per month in most cases.
If you have a long time horizon and can handle the carrying costs, Oakland offers entry points. ZIP 94621 at $443K and 94603 at $505K are below the national median. If you need the Bay Area for work, these are among the few remaining sub-$500K options in the San Francisco metro.
For sellers, the numbers are less encouraging. Every month of delay has cost roughly $5,000 in value over the past year. Waiting for a rebound requires betting against a 10-month trend.
Oakland Housing Market Outlook for 2026-2027
The recent data suggests the freefall is over, but a rebound isn’t here yet.
From March to August 2025, Oakland lost about $52,000 in average value — roughly $8,700 per month. From September 2025 through February 2026, the decline slowed to about $1,600 per month. That’s a sharp deceleration.
If the current pace continues through mid-2026, expect prices to settle in the $755K-$765K range. A return to the $825K peak of March 2025 would require a reversal that the data doesn’t currently support.
The high end of the market (94618) is actually gaining value — it rose from $1,518,400 in August to $1,553,740 in February. The bottom end continues to erode. This divergence could widen as premium neighborhoods stabilize while affordable ZIPs face continued pressure.
Similar Markets in CA
If you’re exploring options beyond Oakland, here are comparable California markets:
- Los Angeles — CA’s largest market, with far more inventory and a different price dynamic than the Bay Area.
- San Diego — Coastal California living with a different employer base and military presence.
- Fresno — Central Valley option with much lower prices and 1.4% population growth.
- Bakersfield — The fastest-growing large city in this data at 3.0%, and significantly more affordable.
- Long Beach — Southern California port city that splits the difference between LA and San Diego pricing.
Frequently Asked Questions
What is the average home price in Oakland?
The average home price in Oakland is $766,688 as of February 2026. This represents the typical home value across all 12 tracked ZIP codes, where prices range from $442,765 in 94621 to $1,553,740 in 94618.
Are home prices going up or down in Oakland?
Prices are going down. Oakland home values fell 7.1% year over year, dropping from $825,704 in March 2025 to $766,688 in February 2026. The decline has been consistent month after month, though the pace slowed significantly in late 2025 and early 2026.
Is it cheaper to rent or buy in Oakland?
Renting is substantially cheaper. The average monthly rent across Oakland is about $2,467, while a mortgage on a median-priced home (20% down, ~7% rate) runs about $4,080 in principal and interest alone. After taxes and insurance, ownership costs roughly double the rent.
What is the most affordable neighborhood in Oakland?
ZIP code 94621 is Oakland’s most affordable at $442,765 — 42% below the citywide average. ZIP 94603 at $505,225 and 94607 at $525,332 are the next most affordable options. All three come in under the national median home price.
Methodology
Home values are based on the Zillow Home Value Index (ZHVI), a smoothed measure of typical home values in the 35th to 65th percentile range. Rent estimates use the Zillow Observed Rent Index (ZORI). Population figures come from the U.S. Census Bureau Population Estimates Program (2020-2024 vintage). All datasets are publicly available. Housing data updated 2026-02-28.