San Leandro Home Prices: $808K, Down 3.8% — 3 ZIPs Analyzed (2026)
Can you still afford a house in San Leandro? At $807,509, the typical home here costs more than most Americans will earn in a decade. But prices are falling. The median is down 3.8% year over year, shedding roughly $32,000 in value over the past twelve months.
Quick answer: The average home price in San Leandro, CA is $807,509 as of February 2026, down 3.8% year over year according to Zillow.
Current Home Prices in San Leandro
San Leandro sits in the San Francisco-Oakland-Berkeley metro, one of the most expensive housing markets in the country. Even with the decline, the city’s median home price remains well above national averages.
| Metric | Value |
|---|---|
| Median Home Price | $807,509 |
| Year-over-Year Change | -3.8% |
| Lowest ZIP Median | $777,465 |
| Highest ZIP Median | $848,121 |
| Number of ZIPs Tracked | 3 |
| Data as of | February 2026 |
The 3.8% annual drop translates to roughly $2,600 per month in lost equity for the typical homeowner. That’s real money — but it’s also an opening for buyers who were priced out during the 2025 peak.
The gap between the cheapest and most expensive ZIP codes in San Leandro is about $70,600. That’s a meaningful spread for a city of this size, and it means the neighborhood you choose matters.
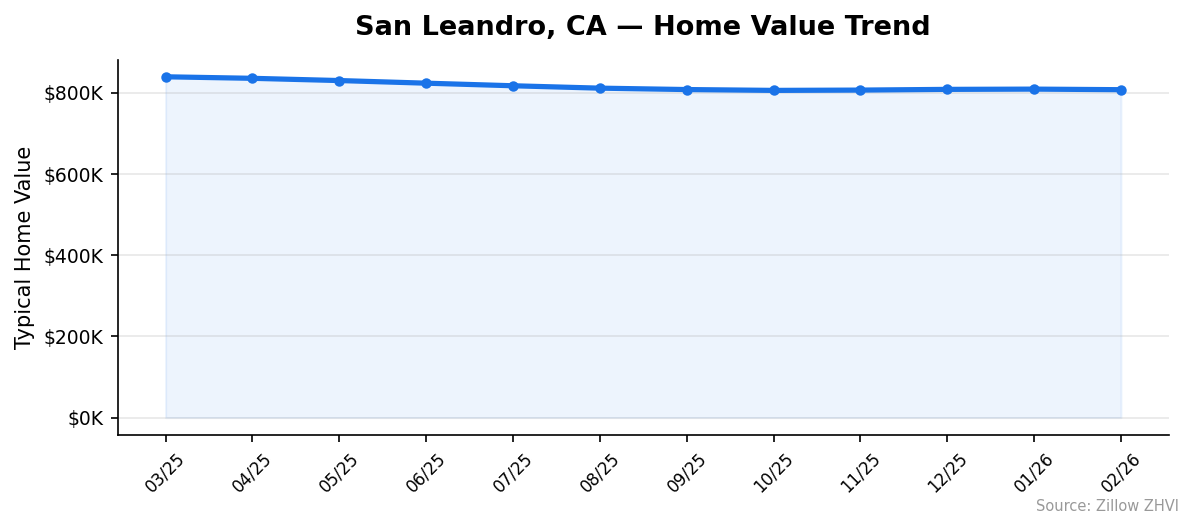
A year ago, in March 2025, the median sat at $839,277. The decline has been gradual but consistent, with no month showing a rebound since summer 2025.
San Leandro Home Prices by Neighborhood
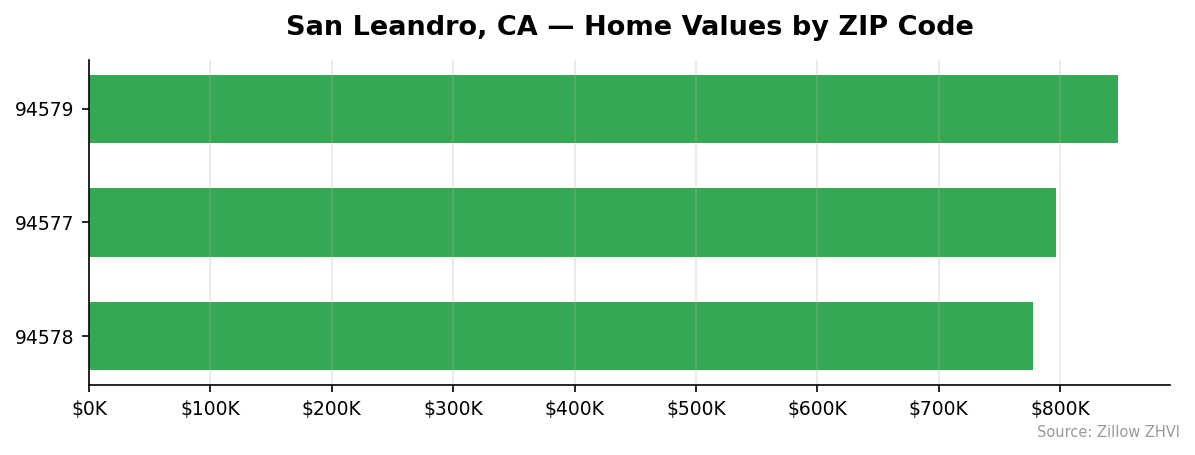
San Leandro has three ZIP codes tracked by Zillow, each with a different price profile.
| ZIP Code | Median Home Value | vs. City Average |
|---|---|---|
| 94579 | $848,121 | +$40,612 |
| 94577 | $796,941 | -$10,568 |
| 94578 | $777,465 | -$30,044 |
Most Expensive
94579 tops the list at $848,121 — about 5% above the city average. No rent data is available for this ZIP, which makes it harder to evaluate as an investment, but its home values lead the city by a wide margin.
Most Affordable
94578 is the cheapest option at $777,465, sitting about $30,000 below the city median. Rent in this ZIP runs $2,522 per month, the highest of the two ZIPs with rent data — an unusual combination of lower purchase prices and higher rents that may appeal to investors.
94577 falls in the middle at $796,941 with rent at $2,325 per month.
Rent vs Buy in San Leandro
Two of San Leandro’s three ZIP codes have rent data available.
| ZIP Code | Monthly Rent (ZORI) |
|---|---|
| 94578 | $2,522 |
| 94577 | $2,325 |
Now compare that to buying. A mortgage on the city median of $807,509 with 20% down ($161,502) leaves a loan of $646,007. At a 7% rate over 30 years, the monthly principal and interest payment comes to roughly $4,296. Add property taxes, insurance, and maintenance, and you’re looking at $5,500 or more per month.
Renting costs less than half of owning. The gap is stark.
That said, rent doesn’t build equity. And with prices dropping, buyers who wait may get a better deal — but they’re also betting that the decline continues. For now, renting gives you flexibility in a falling market. Buying makes sense only if you plan to stay five years or more and can absorb further short-term losses.
Population Growth and Migration
San Leandro is losing residents. The city’s population fell from 90,727 in 2020 to 86,571 in 2024 — a 4.6% decline over four years.
| Year | Population |
|---|---|
| 2020 | 90,727 |
| 2021 | 88,366 |
| 2022 | 86,921 |
| 2023 | 86,555 |
| 2024 | 86,571 |
The sharpest drop came between 2020 and 2021, when the city lost 2,361 people in a single year. The decline slowed after that, and 2024 actually showed a tiny uptick of 16 residents over 2023. It’s too early to call that a turnaround.
Compare San Leandro to other California cities:
| City | 2024 Population | 4-Year Growth |
|---|---|---|
| San Diego | 1,404,452 | +1.4% |
| Fresno | 550,105 | +1.4% |
| Sacramento | 535,798 | +1.9% |
| Oakland | 443,554 | +0.6% |
| Bakersfield | 417,468 | +3.0% |
| San Leandro | 86,571 | -4.6% |
Every comparison city is growing. San Leandro is the outlier. A shrinking population generally means weaker housing demand, which aligns with the price declines the city is experiencing.
San Leandro Housing Market Trends
Here’s how the median home price has moved month by month over the past year:
| Month | Median Price | Monthly Change |
|---|---|---|
| Mar 2025 | $839,277 | — |
| Apr 2025 | $835,508 | -$3,769 |
| May 2025 | $830,010 | -$5,498 |
| Jun 2025 | $823,546 | -$6,464 |
| Jul 2025 | $817,172 | -$6,374 |
| Aug 2025 | $811,297 | -$5,875 |
| Sep 2025 | $807,853 | -$3,444 |
| Oct 2025 | $805,771 | -$2,082 |
| Nov 2025 | $806,516 | +$745 |
| Dec 2025 | $808,278 | +$1,762 |
| Jan 2026 | $808,914 | +$636 |
| Feb 2026 | $807,509 | -$1,405 |
The trend breaks into two phases. From March through October 2025, prices fell every single month, dropping $33,506 in total. Then came a brief plateau — November through January saw small gains. February reversed that again with a $1,405 dip.
The steepest monthly declines happened in May, June, and July 2025, when the city was losing $5,500–$6,500 per month in median value. The pace of decline has clearly slowed, but the market hasn’t found a firm floor yet.
Is San Leandro a Good Place to Buy in 2026?
The numbers point to a buyer’s market. Prices are falling, population is shrinking, and the rent-to-own gap discourages new buyers from entering.
If you’re a buyer, you have the upper hand. Sellers who listed in early 2025 are sitting on homes worth $30,000–$40,000 less than they expected. That creates room to negotiate.
The risk: San Leandro’s underlying demand is weak. A shrinking population in an expensive metro means fewer competing buyers, but also less support for prices if the broader Bay Area market softens further.
If you plan to live in the home for seven or more years and can handle the monthly costs, the declining prices improve your entry point. If you’re looking at San Leandro purely as an investment, the rent yields are thin — $2,300–$2,500 per month against an $800K purchase price works out to a gross yield under 4%.
San Leandro Housing Market Outlook for 2026-2027
The three-month trend from December 2025 through February 2026 shows the market flattening. Prices hovered between $807,509 and $808,914 — a range of just $1,405. That’s nearly flat after months of steady declines.
If the current pace continues, San Leandro prices are likely to drift sideways through mid-2026. The steep drops of summer 2025 appear to be over. But there’s no upward momentum either.
The November-January uptick was too small and too brief to signal a recovery. The February dip confirmed that. Expect the median to trade in the $800,000–$810,000 range through the next few months, barring a significant shift in Bay Area employment or mortgage rates.
Similar Markets in CA
If you’re exploring the California market beyond San Leandro, these cities offer different price points:
- Los Angeles — the state’s largest market with a much wider range of neighborhoods and prices.
- San Diego — a coastal metro with growing population and different supply dynamics.
- Bakersfield — far more affordable than the Bay Area, with the strongest population growth on this list at 3.0%.
- Fresno — another Central Valley option with lower prices and steady growth.
- Long Beach — a Southern California alternative in the LA metro area.
Frequently Asked Questions
What is the average home price in San Leandro?
The average home price in San Leandro is $807,509 as of February 2026. Across the city’s three ZIP codes, prices range from $777,465 in 94578 to $848,121 in 94579. That’s a spread of about $70,600 depending on the neighborhood.
Are home prices going up or down in San Leandro?
Down. San Leandro home prices have fallen 3.8% year over year. The market peaked around $839,277 in March 2025 and has declined in most months since. The rate of decline slowed in late 2025, but prices have not started recovering.
Is it cheaper to rent or buy in San Leandro?
Renting is much cheaper. Monthly rent in San Leandro ranges from $2,325 to $2,522 depending on the ZIP code. A mortgage on the median-priced home would run roughly $4,300 per month in principal and interest alone — before taxes, insurance, and upkeep. Renting saves you at least $1,800 per month compared to owning.
What is the most affordable neighborhood in San Leandro?
ZIP code 94578 has the lowest median home value at $777,465, about $30,000 below the city average. It also has the highest rent of the ZIPs with data at $2,522 per month, which could make it attractive for buy-to-rent investors despite the overall market weakness.
Methodology
Home values are based on the Zillow Home Value Index (ZHVI), a smoothed measure of typical home values in the 35th to 65th percentile range. Rent estimates use the Zillow Observed Rent Index (ZORI). Population figures come from the U.S. Census Bureau Population Estimates Program (2020-2024 vintage). All datasets are publicly available. Housing data updated 2026-02-28.