Detroit Home Prices: $109K, Down 5.1% — 26 ZIPs Analyzed (2026)
Can you still buy a house for under $50,000 in a major American city? In Detroit, yes. The median home value sits at $109,047 as of February 2026, down 5.1% from a year ago. Across 26 tracked ZIP codes, prices range from under $47K to nearly $425K.
Quick answer: The average home price in Detroit, MI is $109,047 as of February 2026, down 5.1% year over year according to Zillow.
Current Home Prices in Detroit
Detroit remains one of the most affordable major cities in the country, and prices are still falling.
| Metric | Value |
|---|---|
| Median Home Value | $109,047 |
| Year-over-Year Change | -5.1% |
| Lowest ZIP Value | $46,963 |
| Highest ZIP Value | $424,914 |
| ZIP Codes Tracked | 26 |
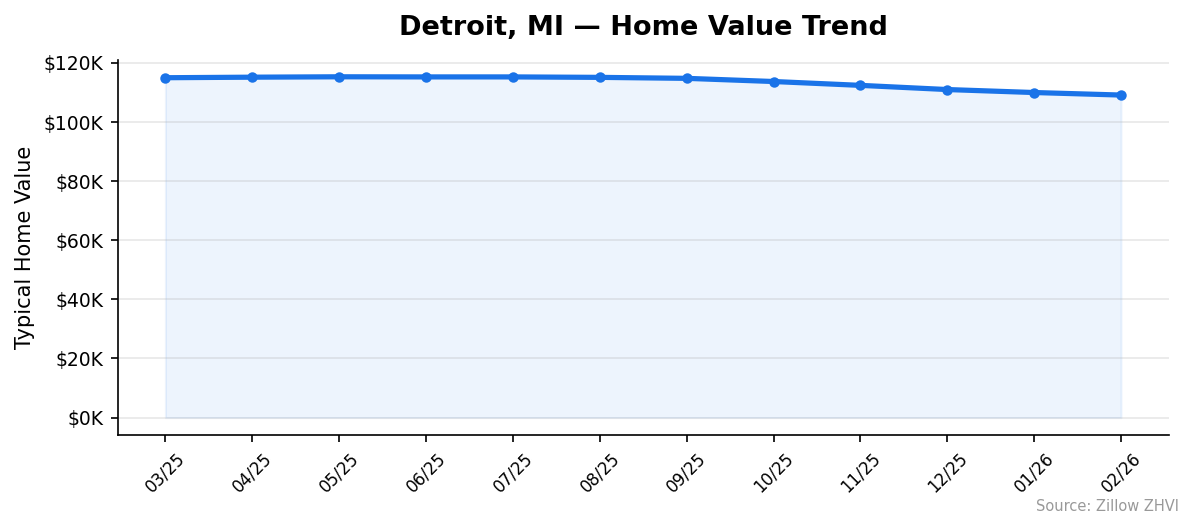
That 5.1% annual drop means a typical Detroit home lost roughly $5,900 in value over the past year. In March 2025, the median was $114,906. By February 2026, it had slid to $109,047 — a steady month-over-month decline with no sign of a bottom yet.
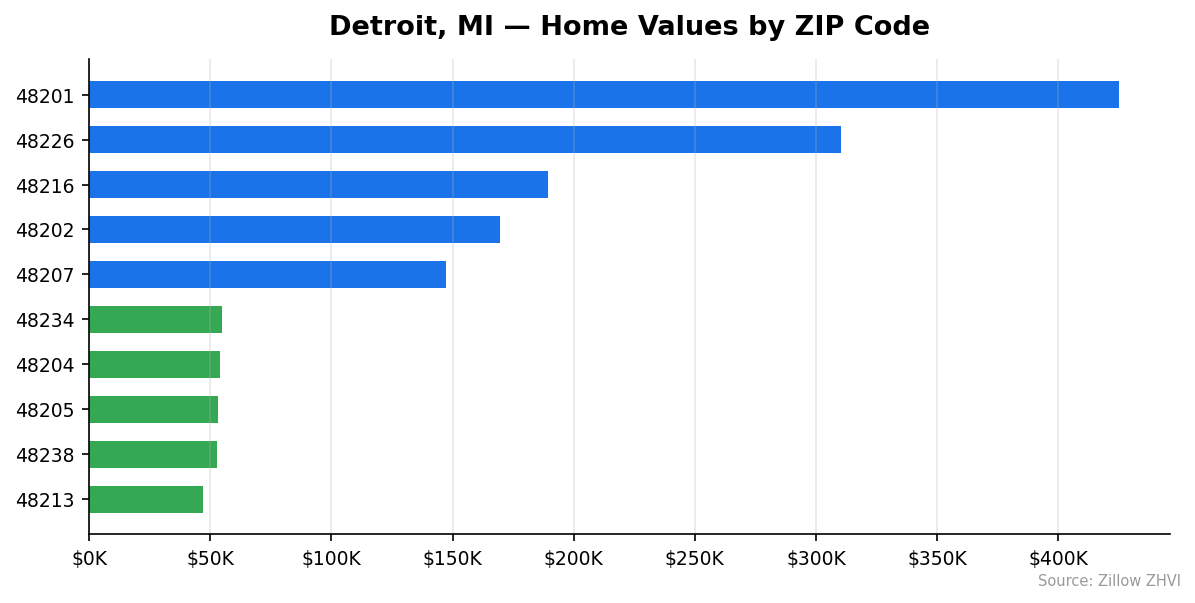
The spread across ZIP codes is enormous. The most expensive neighborhood commands nearly 9x the price of the cheapest one. A $47K home and a $425K home exist in the same city limits. That range makes citywide averages almost meaningless without the ZIP-level breakdown.
For buyers with cash or strong financing, Detroit offers entry points that don’t exist in most metro areas. For existing homeowners, the declining trend cuts both ways.
Detroit Home Prices by Neighborhood
Prices in Detroit vary more by ZIP code than in almost any other U.S. city. Here’s the full picture across all 26 tracked neighborhoods.
| ZIP Code | Typical Home Value | Avg Monthly Rent |
|---|---|---|
| 48201 | $424,914 | $1,505 |
| 48226 | $310,226 | $1,893 |
| 48216 | $189,279 | $1,928 |
| 48202 | $169,467 | $1,370 |
| 48207 | $147,406 | $1,633 |
| 48208 | $130,486 | $1,173 |
| 48221 | $130,135 | $1,332 |
| 48215 | $91,803 | $1,450 |
| 48235 | $89,649 | $1,328 |
| 48219 | $87,478 | $1,296 |
| 48214 | $86,171 | $1,189 |
| 48209 | $85,538 | $986 |
| 48223 | $84,953 | $1,183 |
| 48206 | $83,685 | $1,295 |
| 48224 | $80,946 | $1,287 |
| 48228 | $69,486 | $1,106 |
| 48210 | $67,125 | Data not available |
| 48227 | $67,506 | $1,303 |
| 48211 | $60,521 | Data not available |
| 48217 | $59,738 | Data not available |
| 48203 | $57,061 | Data not available |
| 48234 | $54,662 | $1,231 |
| 48204 | $53,818 | $1,103 |
| 48205 | $53,296 | $1,241 |
| 48238 | $52,901 | $1,152 |
| 48213 | $46,963 | $1,295 |
Most Expensive ZIPs
48201 — $424,914. This downtown/Midtown ZIP is nearly 4x the city median. Despite its high home values, average rent here is only $1,505/month — a relatively low rent-to-price ratio that suggests owner-occupant demand drives prices more than rental yields.
48226 — $310,226. The downtown core commands the second-highest values with the highest rents in the city at $1,893/month.
48216 — $189,279. Southwestern Detroit near Corktown tops the city in average rent at $1,928/month, making it the most expensive ZIP to rent in despite ranking third in home values.
Most Affordable ZIPs
48213 — $46,963. The cheapest ZIP in Detroit sits at less than half the city median. Yet rents here average $1,295/month — meaning landlords see strong yields relative to purchase price.
48238 — $52,901. Homes cost under $53K, and rents average $1,152/month.
48205 — $53,296. At $53K for a typical home and $1,241/month in rent, this east-side ZIP offers one of the lowest barriers to entry in any major U.S. city.
Rent vs Buy in Detroit
Detroit is one of the rare cities where buying is dramatically cheaper than renting on a monthly basis.
The average rent across the 22 ZIP codes with rent data is approximately $1,304/month. A mortgage on the median-priced home of $109,047, assuming 20% down ($21,809) and a 7% interest rate on a 30-year fixed loan, comes to roughly $580/month in principal and interest.
| Monthly Cost | Amount |
|---|---|
| Average Rent | ~$1,304 |
| Mortgage (P&I, 20% down, 7%) | ~$580 |
| Difference | ~$724 |
That’s a $724/month gap favoring buyers. Even adding property taxes and insurance — which run higher in Detroit relative to home values than most cities — buying still comes out well ahead for anyone who plans to stay a few years.
The math is even more dramatic in affordable ZIPs. In 48213, where homes cost $46,963, a mortgage payment would be under $250/month — compared to $1,295/month in rent. That kind of spread makes Detroit one of the strongest buy-over-rent markets in the country.
The catch: Detroit’s declining home values mean you could lose equity in the short term. But if you’re buying for shelter rather than speculation, the monthly savings are hard to ignore.
Population Growth and Migration
After decades of population loss, Detroit is growing again.
| Year | Population |
|---|---|
| 2020 | 638,367 |
| 2021 | 634,939 |
| 2022 | 634,702 |
| 2023 | 638,914 |
| 2024 | 645,705 |
The city bottomed out in 2022 at 634,702 residents, then reversed course. By 2024, population reached 645,705 — a 1.1% gain over four years. The trajectory is clear: Detroit dipped in 2021-2022, stabilized, then started adding people.
How does that compare to other Michigan cities?
| City | 2024 Population | 4-Year Growth |
|---|---|---|
| Troy | 89,209 | 2.4% |
| Lansing | 114,336 | 1.6% |
| Detroit | 645,705 | 1.1% |
| Grand Rapids | 200,117 | 0.7% |
| Farmington Hills | 84,173 | 0.4% |
| Sterling Heights | 134,342 | 0.2% |
Detroit’s 1.1% growth rate sits in the middle of the pack — faster than Grand Rapids and Sterling Heights, slower than Troy and Lansing. For a city that lost over a million residents between 1950 and 2020, any growth at all is a reversal worth watching.
More people should mean more housing demand over time. But so far, that population rebound hasn’t translated into rising home prices.
Detroit Housing Market Trends
The 12-month trend tells a consistent story: steady decline with no reversals.
| Month | Median Value | Monthly Change |
|---|---|---|
| Feb 2026 | $109,047 | -$853 |
| Jan 2026 | $109,900 | -$1,008 |
| Dec 2025 | $110,908 | -$1,414 |
| Nov 2025 | $112,322 | -$1,302 |
| Oct 2025 | $113,624 | -$1,070 |
| Sep 2025 | $114,694 | -$332 |
| Aug 2025 | $115,026 | -$154 |
| Jul 2025 | $115,180 | +$1 |
| Jun 2025 | $115,179 | -$42 |
| May 2025 | $115,221 | +$133 |
| Apr 2025 | $115,088 | +$182 |
| Mar 2025 | $114,906 | — |
The pattern breaks into two phases. From March through July 2025, prices were essentially flat — hovering between $114,906 and $115,221. Then in August, the decline began. Each month since has brought a larger drop than the last.
The most recent three months show accelerating losses: -$1,414 in December, -$1,008 in January, and -$853 in February. The pace may be slowing slightly, but the direction hasn’t changed.
From the July 2025 peak of $115,180 to February 2026, Detroit lost $6,133 in median value — a 5.3% decline in seven months.
Is Detroit a Good Place to Buy in 2026?
The data points in two directions at once.
On the bull case: Detroit has some of the lowest home prices in any major U.S. metro. Monthly mortgage payments are far cheaper than rent. The population is growing for the first time in decades. And the price-to-rent ratio in many ZIPs makes it attractive for investors.
On the bear case: prices have fallen for seven consecutive months, and the decline is accelerating. Buying into a falling market means you could owe more than your home is worth within a year or two.
The answer depends on your timeline. If you’re buying to live in for five or more years, the low entry cost and monthly savings over renting make a strong case. If you’re looking for short-term appreciation, the data doesn’t support that bet right now.
Detroit is a buyer’s market by any measure. Falling prices, growing inventory, and a $109K median mean buyers have negotiating power they won’t find in most cities.
Detroit Housing Market Outlook for 2026-2027
The 12-month trend points to continued price declines through mid-2026. Prices have dropped every month since August 2025, and the pace hasn’t reversed.
If the current trajectory holds, Detroit’s median could dip below $105,000 by summer 2026. The three-month trend shows losses of about $1,000/month, and nothing in the data suggests a floor.
One factor to watch: the population growth. Detroit added nearly 11,000 residents between 2022 and 2024. If that continues, housing demand should eventually put upward pressure on prices. But population growth has been modest, and it hasn’t stopped the slide so far.
The most likely scenario for the next 6-12 months is a continued slow decline, with prices potentially stabilizing in late 2026 as affordability draws more buyers into the market.
Similar Markets in MI
If you’re considering Detroit, these Michigan cities offer different price points and market conditions:
- Ann Arbor — a college town with significantly higher prices than Detroit
- Dearborn — Detroit’s immediate neighbor with its own market dynamics
- Grand Rapids — Michigan’s second-largest city on the west side of the state
- Lansing — the state capital, growing faster than Detroit at 1.6%
- Sterling Heights — a suburban alternative in the same metro area
Frequently Asked Questions
What is the average home price in Detroit?
The average home price in Detroit is $109,047 as of February 2026. That figure represents the Zillow Home Value Index across the city. Prices range from $46,963 in the most affordable ZIP (48213) to $424,914 in the most expensive (48201).
Are home prices going up or down in Detroit?
Prices are going down. Detroit’s median home value fell 5.1% year over year as of February 2026. The decline has been consistent since August 2025, with prices dropping every month for seven straight months.
Is it cheaper to rent or buy in Detroit?
Buying is much cheaper. A mortgage on the median-priced home runs about $580/month (principal and interest with 20% down at 7%), while the average rent across Detroit ZIPs is approximately $1,304/month. That’s a $724/month advantage for buyers.
What is the most affordable neighborhood in Detroit?
ZIP code 48213 has the lowest typical home value at $46,963. Despite rock-bottom prices, rents in this ZIP average $1,295/month — giving investors a high yield relative to purchase price.
Methodology
Home values are based on the Zillow Home Value Index (ZHVI), a smoothed measure of typical home values in the 35th to 65th percentile range. Rent estimates use the Zillow Observed Rent Index (ZORI). Population figures come from the U.S. Census Bureau Population Estimates Program (2020-2024 vintage). All datasets are publicly available. Housing data updated 2026-02-28.