Sterling Heights Home Prices: $310K, Up 3.4% — 4 ZIPs Analyzed (2026)
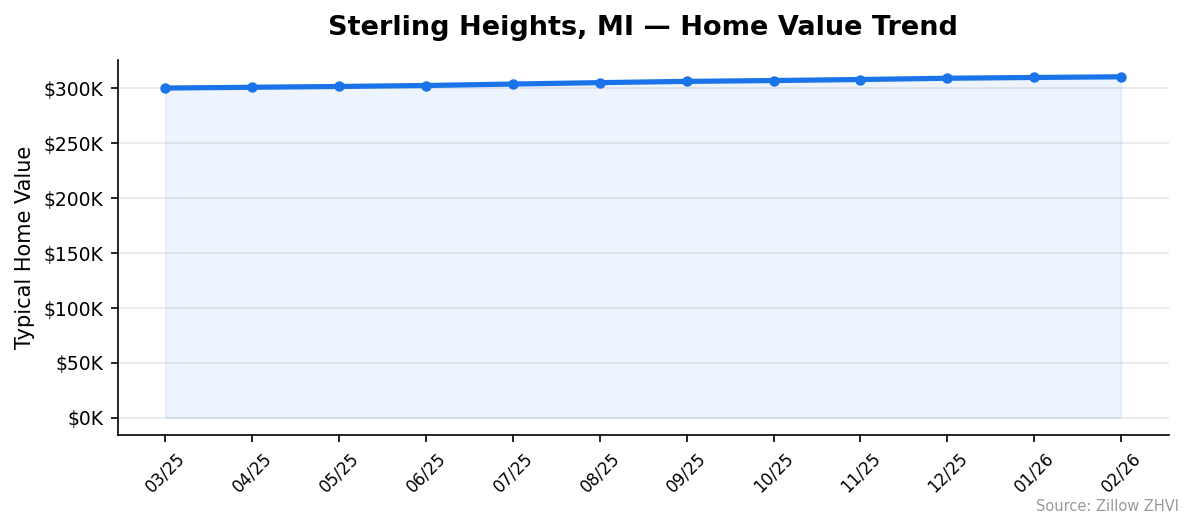
$310,330. That’s what a typical home in Sterling Heights now costs, and the number is 3.4% higher than a year ago. Prices have edged up every single month for the past year.
Quick answer: The average home price in Sterling Heights, MI is $310,330 as of February 2026, up 3.4% year over year according to Zillow.
Current Home Prices in Sterling Heights
The Sterling Heights housing market is slow and steady. Home values have climbed each month for at least a year with no dips. The range across the city’s four ZIP codes is also narrow, which keeps buyer options within a tight band.
| Metric | Value |
|---|---|
| Median home value | $310,330 |
| Year-over-year change | +3.4% |
| Lowest ZIP average | $286,185 |
| Highest ZIP average | $352,737 |
| Spread (max − min) | $66,552 |
| Data as of | February 2026 |
A $66K gap between the cheapest and priciest ZIP is modest for a city this size. In many Metro Detroit suburbs the spread runs into six figures. Here, buyers shopping across ZIPs will see similar-priced listings regardless of which corner of the city they pick.
The $310,330 median also puts Sterling Heights below the national figure and well under close-by Troy, where prices run higher. It sits in the middle of the Detroit-Warren-Dearborn metro on a price-per-home basis: more expensive than Detroit proper, cheaper than the far-western wealthy suburbs.
For context on the pace: a year ago, in March 2025, the median was $300,085. The $10,245 gain works out to about $854 per month of appreciation. That’s steady, not hot.
Sterling Heights Home Prices by Neighborhood
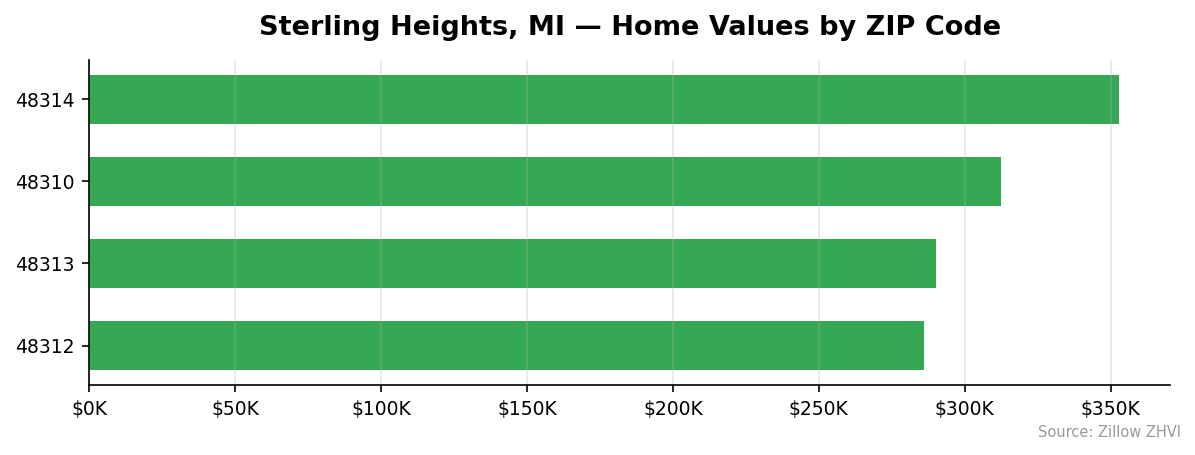
Four ZIPs cover Sterling Heights. Prices vary by roughly 23% from the cheapest to the most expensive.
| ZIP Code | Avg Home Value | Avg Rent | vs City Median |
|---|---|---|---|
| 48314 | $352,737 | $1,763 | +13.7% |
| 48310 | $312,326 | $1,477 | +0.6% |
| 48313 | $290,072 | $1,350 | −6.5% |
| 48312 | $286,185 | $1,656 | −7.8% |
Most Expensive
- 48314 — $352,737. The northeast corner carries the top price tag. It also commands the highest rent at $1,763, reinforcing its premium status in the city.
- 48310 — $312,326. Slightly above the city median. Rents here run lower than you’d expect given the home value, at $1,477.
- 48313 — $290,072. Third place, but only $4K separates it from the cheapest ZIP.
Most Affordable
- 48312 — $286,185. The cheapest ZIP to buy in Sterling Heights. Interestingly, the rent here ($1,656) is higher than in pricier 48310, which tilts the rent-to-own ratio against renters in this ZIP.
- 48313 — $290,072. Close second. Lowest rent in the city at $1,350.
- 48310 — $312,326. Not cheap in absolute terms, but sits right on the city median.
Rent vs Buy in Sterling Heights
Rent data across the four ZIPs averages roughly $1,561 per month. The range spans $1,350 in 48313 to $1,763 in 48314.
Here’s the monthly math on buying at the $310,330 median price, assuming 20% down and a 7% 30-year fixed rate:
| Cost | Monthly |
|---|---|
| Principal & interest (on $248,264 loan) | ~$1,651 |
| Property taxes (estimate, 1.3%) | ~$336 |
| Homeowners insurance (estimate) | ~$100 |
| Total monthly carry | ~$2,087 |
| Average rent in Sterling Heights | ~$1,561 |
Renting wins on month-to-month cost by about $526. You’d also need roughly $62,000 cash for the down payment on a median home, plus closing costs.
That said, the math flips for longer holds. Owners build equity and benefit from the 3.4% annual appreciation the city has posted. If that pace continues, a median-priced home gains about $10,500 in year-one value. That absorbs a meaningful share of the monthly cost gap.
One ZIP throws off the pattern: 48312. It has the cheapest homes ($286,185) but the second-highest rent ($1,656). If you’re renting in 48312, the case for buying is stronger than elsewhere in the city.
Population Growth and Migration
Sterling Heights is barely growing. The population edged from 134,114 in 2020 to 134,342 in 2024 — a 0.2% gain over four years.
| Year | Population |
|---|---|
| 2020 | 134,114 |
| 2021 | 133,204 |
| 2022 | 132,521 |
| 2023 | 133,696 |
| 2024 | 134,342 |
The city actually shrank in 2021 and 2022, then recovered. It’s now 228 residents above the 2020 baseline.
Here’s how it compares to other Michigan cities:
| City | 2024 Population | 4-Year Growth |
|---|---|---|
| Detroit | 645,705 | +1.1% |
| Grand Rapids | 200,117 | +0.7% |
| Sterling Heights | 134,342 | +0.2% |
| Lansing | 114,336 | +1.6% |
| Troy | 89,209 | +2.4% |
| Farmington Hills | 84,173 | +0.4% |
Nearby Troy outpaced Sterling Heights by 12x on the growth rate. Detroit and Lansing also grew faster.
For housing demand, slow population growth means slow buyer turnover. There’s no flood of new residents bidding up prices, which matches the modest 3.4% appreciation. Expect steady rather than sharp moves in Sterling Heights home values.
Sterling Heights Housing Market Trends
Prices have climbed for 12 straight months.
| Month | Avg Home Value |
|---|---|
| Feb 2026 | $310,330 |
| Jan 2026 | $309,702 |
| Dec 2025 | $309,009 |
| Nov 2025 | $307,845 |
| Oct 2025 | $306,920 |
| Sep 2025 | $306,137 |
| Aug 2025 | $304,996 |
| Jul 2025 | $303,724 |
| Jun 2025 | $302,392 |
| May 2025 | $301,526 |
| Apr 2025 | $300,793 |
| Mar 2025 | $300,085 |
No monthly declines in the trailing year. The largest single-month jump was $1,272 (Jul 2025 → Aug 2025). The smallest was $628 (Jan 2026 → Feb 2026).
Something to watch: the pace is easing. Between March and August 2025, the median gained $4,911. Between September 2025 and February 2026, it gained $4,193. A slight deceleration. The most recent three months added just $1,321 — roughly $440 per month — versus $854 per month averaged across the full year.
Translation: prices are still rising, but not as fast as they were last spring.
Is Sterling Heights a Good Place to Buy in 2026?
Three signals point to a mild seller’s market that’s cooling:
- Prices rising, not falling. 3.4% YoY, 12-for-12 monthly gains.
- But momentum fading. The 3-month pace equals about 1.7% annualized — half the trailing-year rate.
- Slow population growth. 0.2% over four years doesn’t generate aggressive bidding.
This is not Austin in 2021 or Phoenix in 2022. Sterling Heights is a steady Metro Detroit suburb where buyers have time to tour homes, negotiate, and avoid waiving inspections.
For a buyer, the 48312 ZIP stands out: cheapest purchase price ($286,185) combined with above-average rent ($1,656). If you plan to stay five or more years, the rent-versus-buy math tilts toward ownership there.
For a seller, the steady appreciation is the story to tell. But listing above the ZIP median is risky given softening momentum.
Sterling Heights Housing Market Outlook for 2026-2027
The 3-month trend suggests slowing, not reversing.
If the current pace continues — roughly $440 per month over December 2025 to February 2026 — Sterling Heights ends 2026 near $314,000 to $316,000. That’s well below what a simple extrapolation of the trailing-12 pace would give you (~$320,000+).
The momentum shift matters. Six months ago, prices were adding nearly $1,100 per month. Now they’re adding under $700. That trajectory, if it holds, points to annual appreciation near 2% by late 2026 rather than the current 3.4%.
Population is not a tailwind. At 0.2% four-year growth, there’s no demographic surge to push prices.
Watch the spring 2026 listing numbers. Sterling Heights typically sees a seasonal bump between March and June. If the 2026 spring is weaker than the 2025 one, expect the YoY rate to compress further by late summer.
Similar Markets in MI
- Detroit — Much cheaper than Sterling Heights, with stronger 4-year population growth.
- Ann Arbor — A higher-priced Michigan market for buyers wanting a university-town alternative.
- Dearborn — Another Detroit-metro option at a similar scale.
- Livonia — A close Metro Detroit suburb worth comparing on price and rent.
- Clinton Township — Directly adjacent to Sterling Heights, worth cross-shopping if you want more ZIPs to pick from.
Frequently Asked Questions
What is the average home price in Sterling Heights?
The average home price in Sterling Heights, MI is $310,330 as of February 2026. That figure is the Zillow Home Value Index median across the city’s four ZIP codes.
Are home prices going up or down in Sterling Heights?
Prices are up 3.4% year over year. A typical home has gained roughly $10,245 in value between March 2025 and February 2026, and prices have risen in all 12 of the past months.
Is it cheaper to rent or buy in Sterling Heights?
Renting is cheaper month to month by about $526. The average rent runs around $1,561, while a mortgage on a median-priced home — with 20% down at a 7% rate, plus taxes and insurance — totals roughly $2,087.
What is the most affordable neighborhood in Sterling Heights?
ZIP code 48312 has the lowest home values at $286,185, about 7.8% below the city median. It also has the second-highest rent in the city at $1,656, so owning there pencils out better than in most Sterling Heights ZIPs.
Methodology
Home values are based on the Zillow Home Value Index (ZHVI), a smoothed measure of typical home values in the 35th to 65th percentile range. Rent estimates use the Zillow Observed Rent Index (ZORI). Population figures come from the U.S. Census Bureau Population Estimates Program (2020-2024 vintage). All datasets are publicly available. Housing data updated 2026-02-28.