Richmond Home Prices: $393K, Up 0.8% — 10 ZIPs Analyzed (2026)
$393,204. That’s the typical home price in Richmond, VA as of February 2026. Prices moved up 0.8% from a year ago — a crawl, not a sprint.
Quick answer: The average home price in Richmond, VA is $393,204 as of February 2026, up 0.8% year over year.
Current Home Prices in Richmond
Richmond sits in the middle of Virginia’s price spectrum. The median is high enough to price out entry-level buyers in some ZIPs, but low enough that the city still undercuts Arlington, Alexandria, and much of Northern Virginia.
Here’s where the numbers stand right now:
| Metric | Value |
|---|---|
| Median home price | $393,204 |
| Year-over-year change | +0.8% |
| Cheapest ZIP | $236,174 (23224) |
| Most expensive ZIP | $627,157 (23221) |
| Price spread | $390,983 |
| ZIPs tracked | 10 |
| Data month | February 2026 |
The 0.8% annual gain is below the national rate of home-price inflation seen in most recent years. Put differently, Richmond is appreciating — but barely.
What the range tells you: the gap between the cheapest and priciest ZIP is nearly $391,000. The most expensive neighborhood costs 2.7 times what the cheapest one does. That’s a wide spread for a city this size, and it gives you real optionality depending on what you can pay.
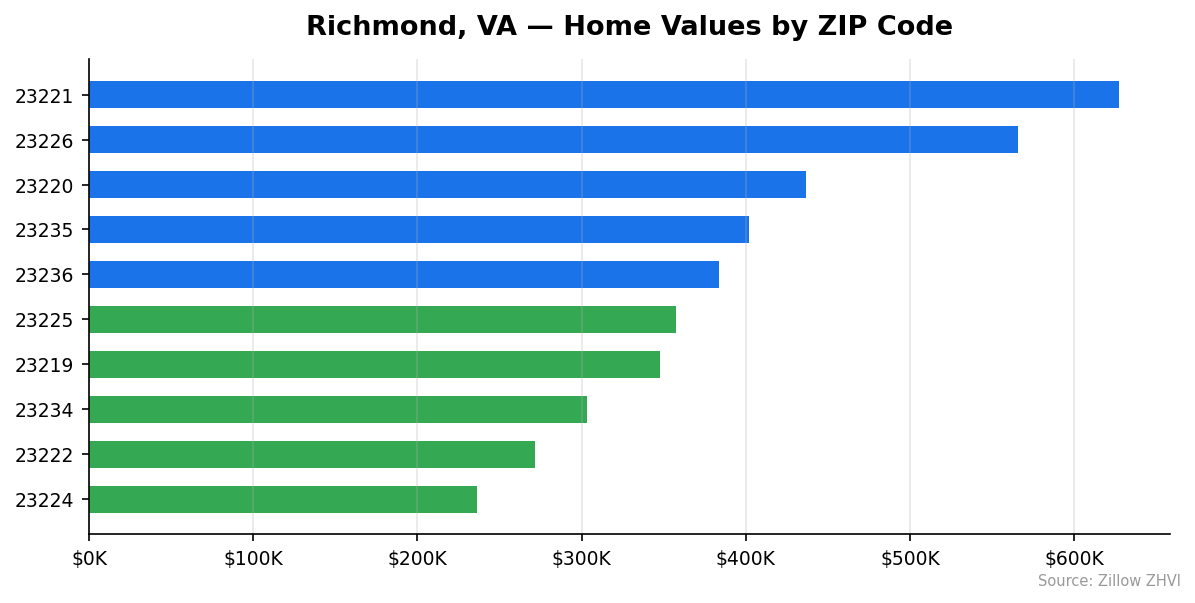
Richmond Home Prices by Neighborhood
Ten ZIP codes make up the Richmond market. Four sit above the citywide median. Six sit below.
| ZIP | Median Price | Avg Rent |
|---|---|---|
| 23221 | $627,157 | $1,675 |
| 23226 | $565,840 | $2,054 |
| 23220 | $436,756 | $1,621 |
| 23235 | $402,141 | $1,950 |
| 23236 | $383,647 | $1,628 |
| 23225 | $357,619 | $1,422 |
| 23219 | $347,581 | $1,557 |
| 23234 | $303,484 | $1,552 |
| 23222 | $271,645 | $1,605 |
| 23224 | $236,174 | $1,529 |
Most Expensive
- 23221 — $627,157. The priciest ZIP in Richmond by a margin of $61,000. Rents sit at $1,675, suggesting owner-occupied single-family demand drives the premium, not rental yield.
- 23226 — $565,840. The only ZIP where rent clears $2,000 a month. That’s a sign of strong rental demand alongside higher purchase prices.
- 23220 — $436,756. Third place, but a steep drop from the top two — roughly $129,000 less than 23226.
Most Affordable
- 23224 — $236,174. The cheapest ZIP in Richmond, 40% below the city median. Rents are close to the citywide average, which tightens the rent-to-price ratio and makes this ZIP friendlier to investors.
- 23222 — $271,645. Second-cheapest. Rents actually beat 23224’s on a per-dollar basis.
- 23234 — $303,484. Just over $300K, with rents at $1,552. The last ZIP in Richmond where you can buy the typical home for under the city median by a meaningful margin.
Rent vs Buy in Richmond
The average rent across Richmond’s 10 ZIPs is roughly $1,659 a month.
Now the buy side. On a $393,204 median home with 20% down ($78,641) and a 30-year fixed mortgage at a 7% rate, your principal and interest payment runs about $2,093 a month. Add property taxes, insurance, and maintenance and you’re closer to $2,600.
That’s a $900 to $1,000 monthly gap in favor of renting.
| Cost | Monthly |
|---|---|
| Typical rent (avg across ZIPs) | $1,659 |
| Mortgage P&I on median home | ~$2,093 |
| Monthly gap (buy minus rent) | ~$434 |
Where it flips: if you’re looking at 23226 ($2,054 rent) or 23235 ($1,950 rent), the rent premium starts to close the gap with a mortgage on a cheaper home. A buyer targeting 23224 at $236,174 would pay roughly $1,260 in P&I — below the rent you’d pay almost anywhere in the city.
So the rent-vs-buy answer depends heavily on where you’re shopping. At the city-wide median, renting wins on monthly cash flow. At the low end of the ZIP distribution, buying starts to make financial sense even before you factor in equity and tax treatment.
Population Growth and Migration
Richmond is gaining residents, not losing them. The city added 6,732 people between 2020 and 2024, a 3.0% four-year gain.
| Year | Population |
|---|---|
| 2020 | 226,923 |
| 2021 | 227,164 |
| 2022 | 228,670 |
| 2023 | 230,383 |
| 2024 | 233,655 |
Growth accelerated in 2024. The city added 3,272 people in that single year — nearly half the four-year total. Whether that pace holds will matter for housing demand in 2026 and beyond.
How Richmond stacks up against other Virginia cities:
| City | 2024 Population | 4-Year Growth |
|---|---|---|
| Chesapeake | 254,997 | +2.1% |
| Richmond | 233,655 | +3.0% |
| Alexandria | 159,102 | 0.0% |
| Hampton | 137,596 | +0.2% |
| Suffolk | 103,105 | +8.8% |
| Lynchburg | 80,301 | +1.7% |
Suffolk is the standout grower. Richmond’s rate beats every other city in the comparison except Suffolk, and it’s adding more people in absolute terms than any of them.
For housing demand, this matters. A growing population with flat-to-slow price growth is unusual — it often signals that supply is keeping up, which tends to cap future appreciation.
Richmond Housing Market Trends
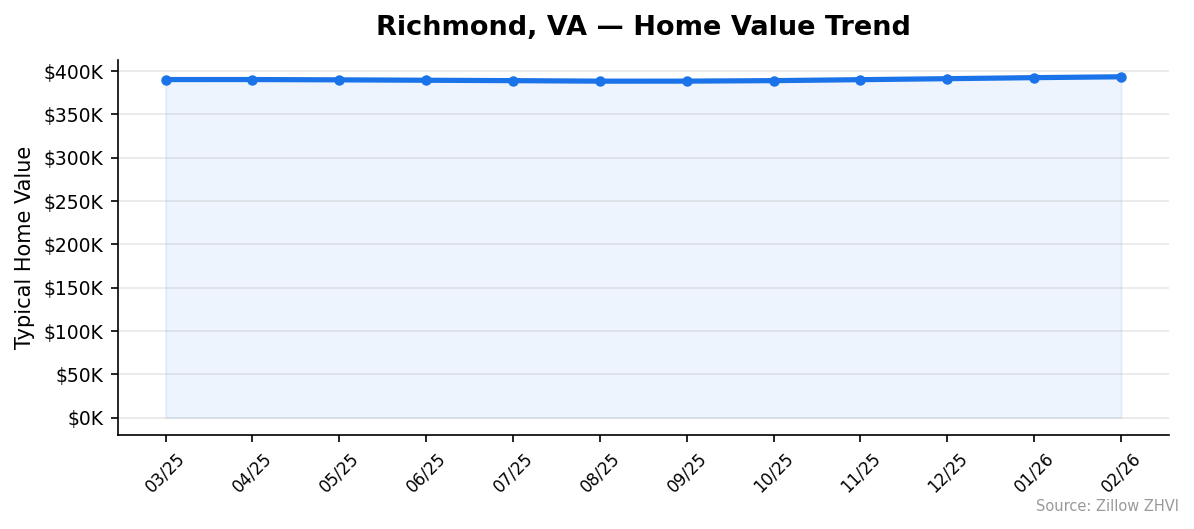
Prices dipped, then recovered. Here’s the 12-month path:
| Month | Median Price |
|---|---|
| Feb 2026 | $393,204 |
| Jan 2026 | $392,215 |
| Dec 2025 | $391,022 |
| Nov 2025 | $389,871 |
| Oct 2025 | $388,773 |
| Sep 2025 | $388,199 |
| Aug 2025 | $388,159 |
| Jul 2025 | $388,751 |
| Jun 2025 | $389,224 |
| May 2025 | $389,678 |
| Apr 2025 | $390,023 |
| Mar 2025 | $390,014 |
Richmond bottomed in August 2025 at $388,159. From that low, prices have climbed every single month. The city has now posted six straight months of gains.
Total movement over 12 months: $3,190, or 0.8%. The recovery from the August trough is worth $5,045 — larger than the net yearly gain, because prices actually fell for the first six months of the stretch.
The trend line is pointing up, but the slope is gentle. Richmond isn’t a market where you need to buy today or miss out.
Is Richmond a Good Place to Buy in 2026?
Depends on what you want.
If you’re a buyer looking for appreciation, Richmond is a slow mover. A 0.8% annual gain doesn’t build wealth fast. You’d make more from paying down principal than from price growth at this pace.
If you’re a buyer looking for stability, Richmond is doing exactly what you want. Prices didn’t crash. Prices didn’t overshoot. The city is growing modestly and prices are tracking that growth.
If you’re an investor, the rent-to-price ratios in the cheaper ZIPs (23224, 23222, 23234) are more attractive than in 23221 or 23226. A $236,174 house renting for $1,529 is a 7.8% gross yield — well above what you’d get in the pricier neighborhoods.
If you’re trading up, the price spread between ZIPs gives you real options. Selling in 23234 and buying in 23221 means roughly $324,000 of price differential — a meaningful upgrade on one transaction.
One caution: the six consecutive monthly gains suggest the post-summer cooling is over. If you’ve been waiting for further declines, the data isn’t cooperating.
Richmond Housing Market Outlook for 2026-2027
The 3-month trend adds roughly $1,000 per month. If the current pace continues through mid-2026, Richmond would see the median land in the high $390Ks to just over $400K.
That’s not a forecast — it’s math on recent momentum. A lot can interrupt it: mortgage rates, inventory shifts, a change in the population growth rate.
What the data argues for: more of the same. Richmond has posted neither a crash nor a boom in the past year. Prices moved in a narrow $5,000 band and settled slightly above where they started. Population is growing steadily. Rents support buying in some ZIPs but not others.
The recovery from August’s low has been consistent. Six straight monthly gains isn’t noise. If the next three months continue at the recent pace, Richmond closes 2026 with annual appreciation in the 1-2% range — low by historical standards, but positive.
Similar Markets in VA
Richmond buyers priced out of 23221 or 23226 might consider cheaper Virginia markets. Buyers wanting more appreciation potential might look elsewhere in the state.
- Henrico — Richmond’s immediate suburban neighbor, often with similar pricing and more inventory.
- Midlothian — A popular Richmond-area suburb for families seeking larger lots.
- Chesapeake — The largest city in the state-level comparison, with slower population growth than Richmond.
- Virginia Beach — Coastal alternative with a very different housing mix.
- Fredericksburg — A smaller market between Richmond and DC, useful if you need commuting access to Northern Virginia.
Frequently Asked Questions
What is the average home price in Richmond?
The average home price in Richmond, VA is $393,204 as of February 2026. That’s based on the Zillow Home Value Index for the 10 ZIP codes in the city. Prices range from $236,174 in 23224 to $627,157 in 23221.
Are home prices going up or down in Richmond?
Up, but slowly. The median rose 0.8% over the past 12 months. Prices bottomed in August 2025 at $388,159 and have gained every month since, finishing February 2026 at $393,204.
Is it cheaper to rent or buy in Richmond?
Renting is cheaper for most buyers at the median. The average rent across Richmond is roughly $1,659 a month, while principal and interest on a median-priced home at current mortgage rates runs about $2,093 — before taxes and insurance. In the cheaper ZIPs like 23224, buying catches up with renting on monthly cost.
What is the most affordable neighborhood in Richmond?
ZIP 23224 is the cheapest in the city at $236,174. That’s 40% below the Richmond median and $391,000 less than 23221, the priciest ZIP. Rents in 23224 are close to the city average at $1,529.
Methodology
Home values are based on the Zillow Home Value Index (ZHVI), a smoothed measure of typical home values in the 35th to 65th percentile range. Rent estimates use the Zillow Observed Rent Index (ZORI). Population figures come from the U.S. Census Bureau Population Estimates Program (2020-2024 vintage). All datasets are publicly available. Housing data updated 2026-02-28.