Clovis Home Prices: $488K, Up 0.1% — 3 ZIPs Analyzed (2026)
$488K. That’s what a typical home costs in Clovis, CA right now — and prices have barely moved in the past year. While much of California sees wild swings, Clovis sits in a holding pattern. Up just 0.1% year over year, the market here is flat by any honest reading.
Quick answer: The average home price in Clovis, CA is $487,720 as of February 2026, up 0.1% year over year according to Zillow.
Current Home Prices in Clovis
| Metric | Value |
|---|---|
| Median Home Price | $487,720 |
| Year-over-Year Change | +0.1% |
| Lowest ZIP Median | $371,472 |
| Highest ZIP Median | $602,166 |
| Number of ZIPs Tracked | 3 |
| Data Through | February 2026 |
A 0.1% annual gain is essentially zero real growth once you factor in inflation. Buyers aren’t seeing appreciation eat into their purchasing power, but sellers aren’t getting windfall gains either.
The spread between the cheapest and most expensive ZIP codes is $230,694. That gap means your buying experience in Clovis depends heavily on which part of town you’re looking at. The western side of the city runs under $375K, while the northeast pushes past $600K.
For context, Clovis sits within the Fresno metro area. It has long served as the more suburban, family-oriented alternative to Fresno proper. That positioning shows up in the price data — Clovis commands a premium over its larger neighbor.
Clovis Home Prices by Neighborhood
| ZIP Code | Median Home Value | Monthly Rent |
|---|---|---|
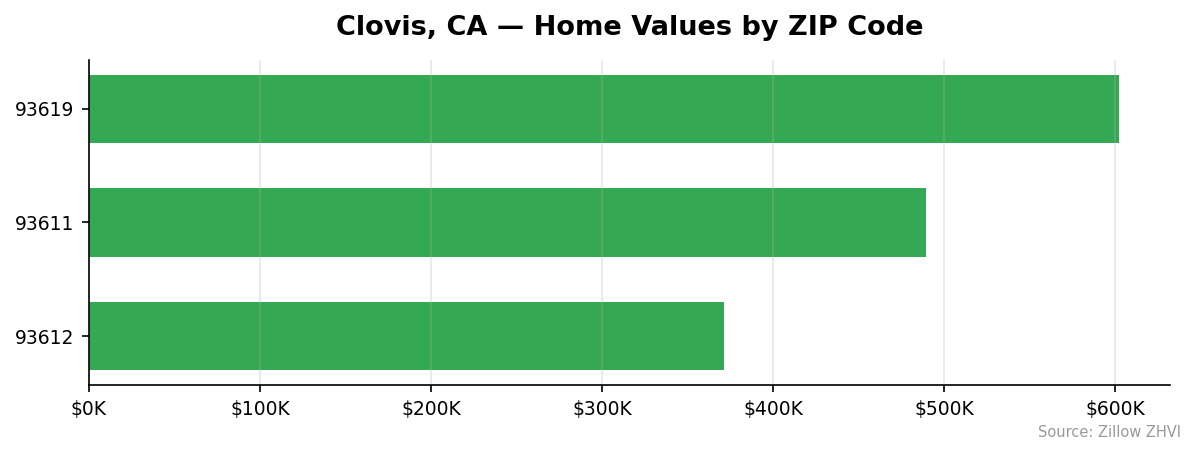
| 93619 | $602,166 | $2,529 |
| 93611 | $489,523 | $2,417 |
| 93612 | $371,472 | $1,716 |
Most Expensive
93619 leads Clovis at $602,166 — that’s 23% above the city median. This northeastern ZIP also carries the highest rents at $2,529 per month, reflecting newer construction and larger lot sizes in that part of the city.
Most Affordable
93612 comes in at $371,472, a full 24% below the city median. Rent here is $1,716 per month, making it the most accessible entry point for both buyers and renters in Clovis. You’d save over $800 per month in rent compared to 93619.
The middle ground is 93611 at $489,523, which tracks almost exactly with the citywide median. If you want a “typical” Clovis home, this ZIP is it.
Rent vs Buy in Clovis
Here’s the math. Take the city median of $487,720. Put 20% down ($97,544) and finance $390,176 at a 7% rate over 30 years. Your monthly principal and interest payment lands around $2,595. Add property taxes, insurance, and maintenance, and you’re well above $3,000 per month in total housing costs.
| ZIP Code | Monthly Rent | Est. Mortgage (P&I) |
|---|---|---|
| 93619 | $2,529 | $3,208 |
| 93611 | $2,417 | $2,608 |
| 93612 | $1,716 | $1,979 |
Renting is cheaper across all three ZIP codes. The gap is narrowest in 93611, where the difference is under $200 per month. In 93619, renting saves you nearly $700 per month before you even count taxes and insurance.
The rent-to-price ratio matters here. In 93612, monthly rent represents about 0.46% of the home value. In 93619, it’s 0.42%. Neither number screams “buy now” from an investment standpoint.
If you’re planning to stay five or more years and expect even modest appreciation, buying can still make sense — especially in 93612, where the entry price is manageable. Short-term buyers should think twice.
Population Growth and Migration
Clovis is one of the faster-growing cities in California’s Central Valley. The population hit 127,993 in 2024, up 6.0% from 120,785 in 2020.
| Year | Population |
|---|---|
| 2020 | 120,785 |
| 2021 | 123,327 |
| 2022 | 125,062 |
| 2023 | 126,314 |
| 2024 | 127,993 |
That’s roughly 1,800 new residents per year. Growth hasn’t slowed — the 2023-to-2024 jump of 1,679 was the second-largest annual gain in the period.
How does Clovis compare to other California cities?
| City | 2024 Population | 4-Year Growth |
|---|---|---|
| Clovis | 127,993 | 6.0% |
| Bakersfield | 417,468 | 3.0% |
| Sacramento | 535,798 | 1.9% |
| San Diego | 1,404,452 | 1.4% |
| Fresno | 550,105 | 1.4% |
| Oakland | 443,554 | 0.6% |
Clovis is growing at double the rate of Bakersfield and more than four times faster than neighboring Fresno. That population pressure supports housing demand. More people competing for a limited housing stock in a geographically constrained city means prices have a floor.
Clovis Housing Market Trends
| Month | Average Value | Low | High |
|---|---|---|---|
| Feb 2026 | $487,720 | $371,472 | $602,166 |
| Jan 2026 | $486,877 | $370,393 | $601,356 |
| Dec 2025 | $485,437 | $368,871 | $599,912 |
| Nov 2025 | $483,599 | $367,114 | $597,681 |
| Oct 2025 | $481,848 | $365,617 | $595,325 |
| Sep 2025 | $481,148 | $364,962 | $594,351 |
| Aug 2025 | $481,407 | $364,805 | $595,108 |
| Jul 2025 | $482,998 | $365,705 | $597,604 |
| Jun 2025 | $484,647 | $366,815 | $599,793 |
| May 2025 | $485,985 | $368,133 | $601,203 |
| Apr 2025 | $486,816 | $369,427 | $601,698 |
| Mar 2025 | $487,447 | $370,786 | $601,810 |
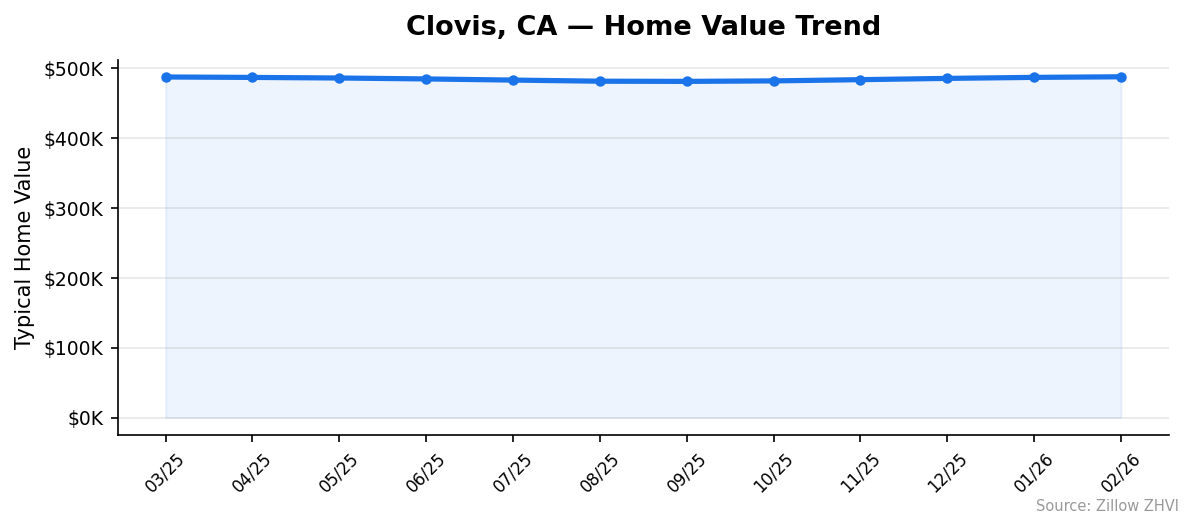
The 12-month pattern tells a clear story. Prices drifted down from March 2025 ($487,447) through September 2025 ($481,148) — a decline of about $6,300 or 1.3%. Then the market reversed. From September through February 2026, prices climbed $6,572, recovering everything lost and adding a bit more.
The result is a market that went nowhere in a year. February 2026’s $487,720 is almost identical to March 2025’s $487,447. You’re looking at a sideways market.
One notable detail: the high-end ZIP (93619) has been more stable than the low-end ZIP (93612), which saw a wider percentage swing during the mid-year dip.
Is Clovis a Good Place to Buy in 2026?
The data points to a balanced market. Neither buyers nor sellers hold a strong advantage right now.
For buyers, the flat pricing means you’re not chasing a runaway market. There’s no urgency premium. You can take your time, compare neighborhoods, and negotiate. The 0.1% YoY appreciation means your home won’t gain much value in the short term, but it also means you’re not buying at a peak.
For sellers, the steady recovery since September 2025 is encouraging, but five consecutive months of gains hasn’t pushed prices past their spring 2025 levels. You’re selling into a stable market, not a hot one.
The population growth rate — 6% over four years — works in favor of long-term buyers. More residents need housing. Clovis isn’t building fast enough to keep pace, which puts gradual upward pressure on prices.
If you can find a property in 93612 under $375K and plan to hold for at least five years, the numbers work.
Clovis Housing Market Outlook for 2026-2027
The five-month upward trend from September 2025 through February 2026 shows steady momentum. Prices gained about $1,300 per month during that stretch.
If the current pace continues through summer 2026, expect the citywide median to push into the low $490K range. That would represent a modest 1-2% gain from current levels.
The seasonal pattern visible in the data — prices softening in late summer, recovering in fall and winter — could repeat. Watch for a potential dip around August-September 2026 if this cycle holds.
Population growth remains the strongest tailwind. With nearly 1,800 new residents arriving each year, demand isn’t going away. But without a catalyst like a major employer relocation or a sharp drop in mortgage rates, don’t expect a breakout above $500K in the near term.
Similar Markets in CA
If you’re exploring Clovis, these nearby California markets offer useful comparisons:
- Fresno — Clovis’s neighbor to the west, typically priced lower with a much larger inventory to choose from.
- Bakersfield — Another Central Valley option, growing at 3% with generally lower home prices than Clovis.
- Riverside — Inland Empire pricing for buyers willing to look south of the Central Valley.
- Fontana — A growing Inland Empire city that draws similar suburban family buyers.
- Anaheim — Significantly pricier, but worth comparing if you’re weighing Central Valley affordability against coastal proximity.
Frequently Asked Questions
What is the average home price in Clovis?
The median home price in Clovis, CA is $487,720 as of February 2026. That figure represents the typical home value across three tracked ZIP codes, with prices ranging from $371,472 in 93612 to $602,166 in 93619.
Are home prices going up or down in Clovis?
Prices are essentially flat, up just 0.1% year over year. The market dipped about 1.3% from spring through fall 2025, then recovered over five consecutive months. The net result is a sideways market with no strong directional signal.
Is it cheaper to rent or buy in Clovis?
Renting is cheaper in all three Clovis ZIP codes. The citywide average rent runs about $2,220 per month, while a mortgage on the median home (with 20% down at 7%) costs roughly $2,595 in principal and interest alone. Add taxes and insurance and the gap widens further.
What is the most affordable neighborhood in Clovis?
ZIP code 93612 is the most affordable area with a median home value of $371,472 and average monthly rent of $1,716. It’s 24% below the city median, making it the best entry point for budget-conscious buyers.
Is Clovis growing or shrinking?
Clovis is growing steadily. The population reached 127,993 in 2024, up 6.0% from 120,785 in 2020. That growth rate is the highest among comparable California cities tracked, including Fresno (1.4%), Sacramento (1.9%), and Bakersfield (3.0%).
Methodology
Home values are based on the Zillow Home Value Index (ZHVI), a smoothed measure of typical home values in the 35th to 65th percentile range. Rent estimates use the Zillow Observed Rent Index (ZORI). Population figures come from the U.S. Census Bureau Population Estimates Program (2020-2024 vintage). All datasets are publicly available. Housing data updated 2026-02-28.