Lynchburg Home Prices: $255K, Up 1% — 5 ZIPs Analyzed (2026)
$255,409. That’s the typical home value in Lynchburg, VA as of February 2026. Prices are up 1.0% from a year ago — a small gain, but the market has posted steady monthly increases since mid-2025.
Quick answer: The average home price in Lynchburg, VA is $255,409 as of February 2026, up 1.0% year over year according to Zillow.
Current Home Prices in Lynchburg
The city sits well below the national median. Here’s where Lynchburg stands right now:
| Metric | Value |
|---|---|
| Median home value | $255,409 |
| Year-over-year change | +1.0% |
| Cheapest ZIP | $173,313 |
| Priciest ZIP | $362,379 |
| Price spread | $189,066 |
| ZIP codes tracked | 5 |
| Data as of | February 2026 |
The gap between the cheapest and priciest ZIP is $189,066. That’s a 109% difference — meaning the top end of Lynchburg costs more than double the bottom. For a city this size, that’s a wide band.
The 1.0% annual gain is tame. Compared to the double-digit swings many Virginia metros saw in 2021-2022, Lynchburg’s market looks orderly. Month-to-month changes have been in the range of a few hundred dollars since last spring.
You get affordability here. The $255K median is roughly 35-40% below what a buyer would pay in Northern Virginia metros like Arlington or Alexandria. That pricing positions Lynchburg as a budget entry point into Virginia homeownership, especially for remote workers or retirees who don’t need DC-area proximity.
Lynchburg Home Prices by Neighborhood
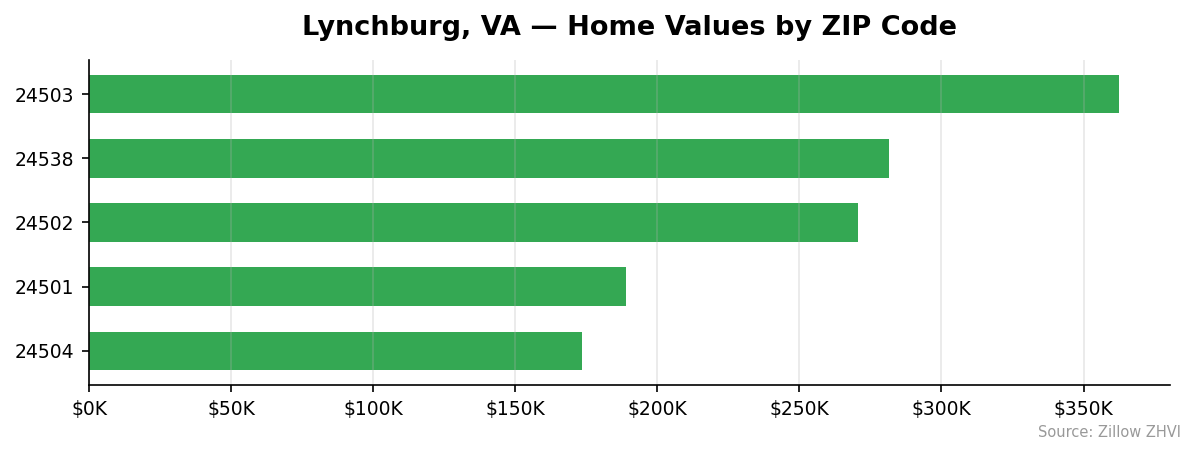
Five ZIPs cover the city. The range is wide.
| ZIP Code | Median Value | vs City Avg | Typical Rent |
|---|---|---|---|
| 24503 | $362,379 | +42% | $1,246 |
| 24538 | $281,629 | +10% | — |
| 24502 | $270,646 | +6% | $1,497 |
| 24501 | $189,080 | -26% | $1,244 |
| 24504 | $173,313 | -32% | $1,115 |
Most Expensive
- 24503 — $362,379. The priciest corner of Lynchburg at 42% above the city median, yet rent here is only $1,246 — lower than 24502. That rent-to-value ratio points to established owner-occupied housing rather than investor stock.
- 24538 — $281,629. Sits 10% above the city average with no rent data reported, suggesting a small, owner-heavy rental pool.
- 24502 — $270,646. Close to the city median on home values but commands the highest rent in the city at $1,497, a signal of stronger rental demand.
Most Affordable
- 24504 — $173,313. The cheapest ZIP, 32% below city average. Rent is also the lowest at $1,115 — the most budget-friendly option for both buyers and renters.
- 24501 — $189,080. The downtown-adjacent ZIP runs 26% below the median, with rent around $1,244.
- 24502 — $270,646. Included here only because Lynchburg has five ZIPs total; it’s actually mid-market, not affordable.
Rent vs Buy in Lynchburg
Renters pay less in Lynchburg. The numbers are clear.
| ZIP Code | Typical Rent | Home Value | Price-to-Rent Ratio |
|---|---|---|---|
| 24502 | $1,497 | $270,646 | 15.1 |
| 24503 | $1,246 | $362,379 | 24.2 |
| 24501 | $1,244 | $189,080 | 12.7 |
| 24504 | $1,115 | $173,313 | 13.0 |
A mortgage on the $255,409 median with 20% down at current rates runs roughly $1,350-$1,400 in principal and interest alone. Add property tax (Lynchburg’s rate is about 1.1%), insurance, and you’re looking at $1,750-$1,900 monthly before any repairs.
Typical rent across the four ZIPs with data averages $1,275. That’s a $475-$625 monthly gap favoring renters.
The price-to-rent ratio tells the full story. A ratio under 15 usually favors buying. Three of the four ZIPs with rent data come in at or below that threshold — 24501, 24502, and 24504. ZIP 24503 at 24.2 is the outlier, where renting makes clear financial sense.
For short-term stays under 5 years, rent. For longer horizons in the cheaper ZIPs, buying builds equity faster than the rent gap costs you.
Population Growth and Migration
Lynchburg is growing slowly but consistently. Here’s the 5-year arc:
| Year | Population |
|---|---|
| 2020 | 78,993 |
| 2021 | 79,137 |
| 2022 | 79,279 |
| 2023 | 79,775 |
| 2024 | 80,301 |
That’s a 1.7% gain over four years — about 1,300 net new residents. It’s below Virginia’s hotter markets but firmly in growth territory.
Here’s how it stacks up against other Virginia cities:
| City | 2024 Population | 4-Yr Growth |
|---|---|---|
| Suffolk | 103,105 | +8.8% |
| Richmond | 233,655 | +3.0% |
| Chesapeake | 254,997 | +2.1% |
| Lynchburg | 80,301 | +1.7% |
| Hampton | 137,596 | +0.2% |
| Alexandria | 159,102 | 0.0% |
Lynchburg grew faster than Hampton and Alexandria, slower than Richmond and Chesapeake. Suffolk is the state’s outlier at 8.8%.
Steady in-migration helps explain the firming home prices. When population ticks up, demand for housing follows. Lynchburg hasn’t seen the demand shock some metros have, so prices creep rather than jump. For buyers, that’s a feature, not a bug — you get stability without getting priced out.
Lynchburg Housing Market Trends
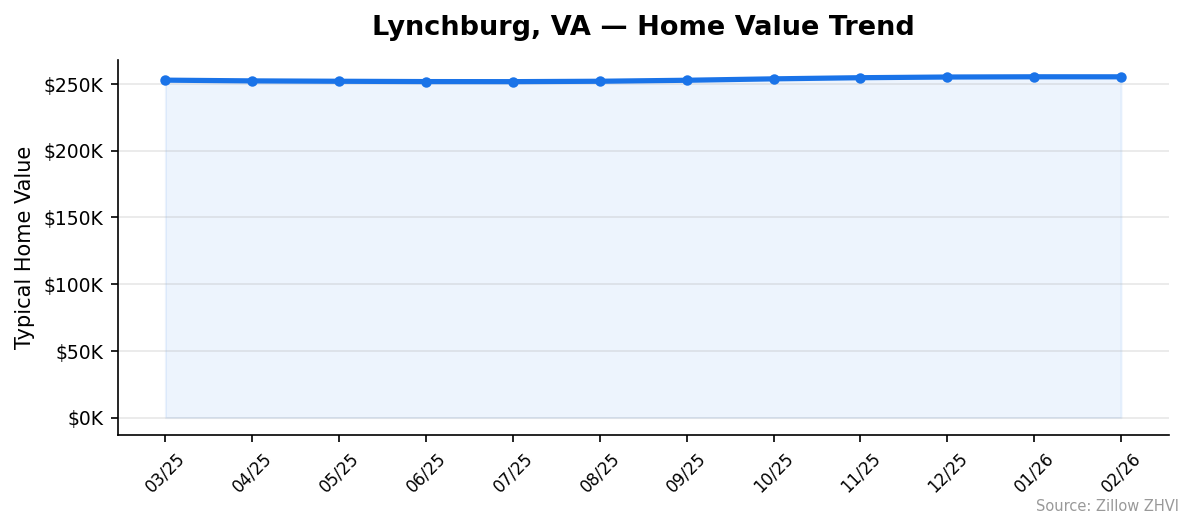
Twelve months of data show a market that rose quietly and kept rising.
| Month | Median Value |
|---|---|
| 2026-02 | $255,409 |
| 2026-01 | $255,430 |
| 2025-12 | $255,258 |
| 2025-11 | $254,745 |
| 2025-10 | $253,888 |
| 2025-09 | $252,827 |
| 2025-08 | $252,079 |
| 2025-07 | $251,791 |
| 2025-06 | $251,842 |
| 2025-05 | $252,075 |
| 2025-04 | $252,356 |
| 2025-03 | $252,911 |
The low point was July 2025 at $251,791. From there, values climbed for seven straight months before a $21 dip in February. The total gain from July to February is $3,618 — about 1.4% over seven months.
Early 2025 showed a slight softening as prices drifted from $252,911 in March down to the July bottom. That was a $1,120 pullback over four months, or less than half a percent.
The pattern is a V-shape: mild dip, then steady recovery. No dramatic moves either direction. Volatility is low.
Is Lynchburg a Good Place to Buy in 2026?
The data supports buying, with caveats.
Prices are rising but gently. You’re not catching a falling knife, and you’re not paying a premium for momentum. The 1.0% annual gain tracks below inflation, which means real purchasing power is on the buyer’s side.
Affordability holds up. At $255K, Lynchburg sits far below Virginia metros that get the headlines. Median household income in the city supports this price point better than it would in Northern Virginia.
The rent-to-buy math in ZIPs 24501, 24502, and 24504 favors ownership over a multi-year horizon. ZIP 24503 is rental territory unless you need that specific market.
Population growth of 1.7% over four years is modest but positive. That’s enough to sustain demand without overheating supply.
The caveat: this is a thin market. Only five ZIPs. Inventory availability at any moment may force compromises on location or features.
Lynchburg Housing Market Outlook for 2026-2027
The 3-month trend shows prices essentially flat — $255,258 in December, $255,430 in January, $255,409 in February. That’s a $151 swing in either direction on a $255K base.
The 6-month pace is clearer. From September’s $252,827 to February’s $255,409, values rose $2,582, or about 1.0%. If the current pace continues, expect Lynchburg to finish 2026 somewhere in the $257K-$260K band.
No data here suggests a break from that pattern. No signal of a sharp acceleration, no signal of a reversal. The market has settled into a low-single-digit annual growth rhythm.
Buyers should plan around steady rather than explosive appreciation. Sellers who were hoping for double-digit gains won’t get them from this trend alone. Builders and investors watching Lynchburg should expect predictable, slow-growth conditions through the next 12-18 months.
Similar Markets in VA
- Suffolk — Virginia’s fastest-growing city on this list at 8.8%, a useful comparison if you want more population momentum than Lynchburg offers.
- Hampton — Similar slow-growth profile to Lynchburg but in the Hampton Roads region.
- Chesapeake — Larger city with 2.1% growth, worth a look if you need a bigger job market.
- Richmond — The state capital offers more scale and 3.0% growth for buyers who want urban amenities.
- Fredericksburg — A commuter-friendly option between Lynchburg’s pricing and Northern Virginia access.
Frequently Asked Questions
What is the average home price in Lynchburg?
The typical home value in Lynchburg, VA is $255,409 as of February 2026. That figure represents the middle tier of the city’s housing stock across five ZIP codes. It sits well below the national median and most Virginia metros.
Are home prices going up or down in Lynchburg?
Prices are up 1.0% year over year. The city bottomed out at $251,791 in July 2025 and has climbed in most months since. The gain is modest — below inflation — so real price pressure on buyers is minimal.
Is it cheaper to rent or buy in Lynchburg?
Renting is cheaper month-to-month. Typical rent runs around $1,275, while a mortgage on the median home plus taxes and insurance lands closer to $1,800. Over longer hold periods of five-plus years, buying usually wins in ZIPs 24501, 24502, and 24504 where price-to-rent ratios are under 15.
What is the most affordable neighborhood in Lynchburg?
ZIP 24504 is the cheapest at $173,313 — 32% below the city average. It also has the lowest rent at $1,115 per month. For budget-focused buyers or renters, 24504 is the starting point.
Methodology
Home values are based on the Zillow Home Value Index (ZHVI), a smoothed measure of typical home values in the 35th to 65th percentile range. Rent estimates use the Zillow Observed Rent Index (ZORI). Population figures come from the U.S. Census Bureau Population Estimates Program (2020-2024 vintage). All datasets are publicly available. Housing data updated 2026-02-28.