Sterling Home Prices: $649K, Down 0.1% — 3 ZIPs Analyzed (2026)
$649,120. That is what a typical home in Sterling, VA costs as of February 2026. Prices have barely moved in a year, slipping 0.1% from where they sat last spring.
Quick answer: The average home price in Sterling, VA is $649,120 as of February 2026, down 0.1% year over year according to Zillow.
Current Home Prices in Sterling
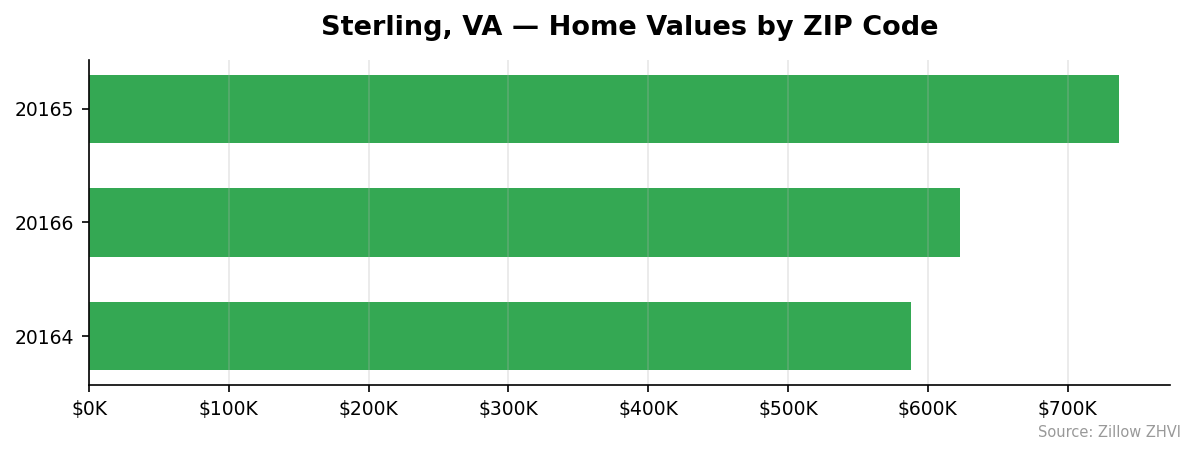
Sterling sits inside the Washington-Arlington-Alexandria metro, and the pricing reflects it. Homes across the three Sterling ZIP codes range from roughly $588K on the low end to $736K at the top.
| Metric | Value |
|---|---|
| Median home price | $649,120 |
| Year-over-year change | -0.1% |
| Lowest ZIP average | $587,849 |
| Highest ZIP average | $736,471 |
| Price spread | $148,622 |
| ZIP codes tracked | 3 |
| Data as of | Feb 2026 |
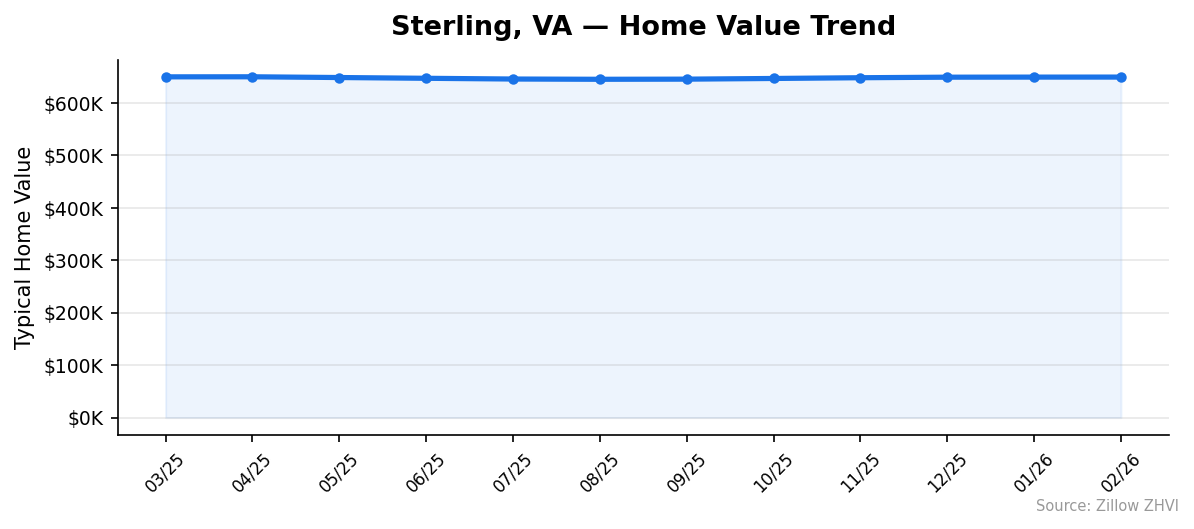
The story here is not a crash or a boom. It is stasis. Twelve months ago the average was $649,677. Today it is $649,120. That is a $557 swing on a home worth the better part of a million dollars.
You can see the spread between neighborhoods, though. A buyer shopping the bottom of the market pays about $148K less than someone chasing the top end. That is roughly 20% of the median price, which is a wide gap for a town with only three ZIPs.
What pushed prices this flat? The monthly data shows a shallow dip through the summer and fall of 2025, followed by a small recovery. The market hit a low near $644,911 in August 2025 before grinding back up. No dramatic move in either direction.
For buyers, Sterling in early 2026 behaves more like a plateau than a trend line. Sellers who expected another year of appreciation are getting a year of sideways.
Sterling Home Prices by Neighborhood
Three ZIP codes cover Sterling. The gap between them is wider than the citywide change over the last year.
| ZIP Code | Average Home Price | Average Rent | vs City Average |
|---|---|---|---|
| 20164 | $587,849 | $2,421 | -9.4% |
| 20165 | $736,471 | $2,297 | +13.4% |
| 20166 | $623,040 | $2,434 | -4.0% |
Most Expensive
- 20165 — $736,471. The priciest ZIP in Sterling by a wide margin, running about 13% above the city average. Interestingly, rents here are the lowest of the three ZIPs at $2,297, which points to a buy-heavy market rather than a rental one.
- 20166 — $623,040. Mid-tier pricing but the highest rent in town at $2,434 a month. That combination suggests stronger rental demand relative to home values.
- 20164 — $587,849. The cheapest of the three and also the only one sitting below the Sterling average.
Most Affordable
- 20164 — $587,849. Cheapest ZIP, about 9.4% under the citywide median. Rent of $2,421 makes it roughly middle-of-the-pack for tenants.
- 20166 — $623,040. Second cheapest for buyers but the most expensive for renters. A renter-to-owner path here faces a larger price gap than the headline numbers suggest.
- 20165 — $736,471. The least affordable option and the one most likely to push first-time buyers toward the other two ZIPs.
Rent vs Buy in Sterling
Rent wins, and it is not close.
Average rent across the three Sterling ZIPs works out to roughly $2,384 a month. The spread is tight: $2,297 at the low end in 20165, $2,434 at the high end in 20166. You pay about $137 more or less depending on the ZIP.
Now run the buy math. On a $649,120 home with 20% down, you are financing $519,296. At a 7% rate on a 30-year mortgage, principal and interest alone run about $3,455 a month. Add property taxes (Loudoun County averages around 1%) and homeowners insurance, and you are closer to $4,200 total.
| Cost | Monthly |
|---|---|
| Average rent (all ZIPs) | ~$2,384 |
| Mortgage P&I ($649K, 20% down, 7%) | ~$3,455 |
| Full carrying cost (with tax + insurance) | ~$4,200 |
| Monthly gap (buy vs rent) | ~$1,816 |
That is nearly $22,000 a year in extra monthly cash outflow to own rather than rent. Equity builds slowly in year one, so the financial case for buying depends on how long you plan to stay and whether Sterling resumes price growth. With prices flat over the last year, a buyer banking on appreciation is betting without much recent evidence.
If you are weighing your first few years in the area, renting in 20165 — the ZIP with the lowest rent and the highest home prices — is the cleanest arbitrage.
Sterling Housing Market Trends
The 12-month picture is a gentle U-shape.
| Month | Average Price |
|---|---|
| Mar 2025 | $649,566 |
| Apr 2025 | $649,677 |
| May 2025 | $648,264 |
| Jun 2025 | $646,808 |
| Jul 2025 | $645,414 |
| Aug 2025 | $644,911 |
| Sep 2025 | $645,181 |
| Oct 2025 | $646,479 |
| Nov 2025 | $647,885 |
| Dec 2025 | $648,922 |
| Jan 2026 | $649,073 |
| Feb 2026 | $649,120 |
Prices drifted down from April through August — a five-month slide of about $4,766, or 0.7%. Then the market turned. September onward, values climbed for six straight months and almost fully recovered.
Read that pattern carefully. Sterling did not boom and did not bust. It wobbled. The total peak-to-trough move was $4,766, which is less than 1% of the home value. That is noise, not a trend reversal.
Buyers who waited for a correction in summer 2025 got one — and then watched it unwind by winter.
Is Sterling a Good Place to Buy in 2026?
The data points to a balanced market, leaning slightly toward buyers.
Year-over-year prices are flat. Buyers get more room to negotiate when sellers cannot count on appreciation to do the work for them. A flat market means more room to push back on asking prices and ask for concessions.
On the other hand, the rent-to-buy math heavily favors renting right now. You would spend about $1,800 more per month to own versus rent. That gap only makes sense if prices resume climbing or you plan to stay a decade.
The bright spot for buyers: price dispersion between ZIPs is wide. You can shop 20164 and save nearly $50,000 off the median without leaving Sterling. That optionality matters when rates are high and every dollar of principal counts.
If you are relocating for a federal or DC-area job and need to be in Sterling, 2026 is a fair year to buy. If you have flexibility, renting in 20165 and watching the trend through summer is the lower-risk play.
Sterling Housing Market Outlook for 2026-2027
The 3-month trend shows prices ticking up by about $47 between December and February — the flattest kind of flat. The 6-month trend is stronger, with prices up $3,939 from August through February.
If the current pace continues, Sterling enters spring 2026 with mild upward momentum. The U-shape of the last 12 months suggests the summer slump may be a seasonal rather than structural pattern. Watch May through August for a repeat.
A year-over-year reading of essentially zero, combined with a rising 6-month trend, typically indicates a market that has absorbed a shock and stabilized. Barring a rate move or a regional employment shift, prices look set to hold or inch higher over the next two quarters.
Do not expect fireworks. Sterling in 2026 is a market defined by how little it moves.
Similar Markets in VA
If Sterling’s $649K median is outside your budget, other Virginia cities offer different price points inside the same state.
- Fairfax — The closest comp geographically and a direct alternative for DC-area buyers.
- Arlington — Inside the Beltway and typically pricier, worth checking if your commute shifts.
- Woodbridge — Further south on I-95 and a common step-down for buyers priced out of Sterling.
- Fredericksburg — An exurban option about an hour south with a lower entry price.
- Virginia Beach — A coastal market for buyers open to leaving the DC metro entirely.
Frequently Asked Questions
What is the average home price in Sterling?
The average home price in Sterling, VA is $649,120 as of February 2026. That number reflects the typical home across the three ZIP codes that make up the city.
Are home prices going up or down in Sterling?
Prices are down 0.1% year over year — essentially flat. The 12-month change is smaller than a single month of typical movement, and the 6-month trend is slightly positive.
Is it cheaper to rent or buy in Sterling?
Renting is significantly cheaper. Average rent is about $2,384 a month, while the full cost of owning a median-priced home runs closer to $4,200. That is roughly $1,800 a month in favor of renting.
What is the most affordable neighborhood in Sterling?
ZIP 20164 is the most affordable, with an average home price of $587,849. That is about 9.4% below the citywide median and roughly $149,000 less than the priciest ZIP, 20165.
Methodology
Home values are based on the Zillow Home Value Index (ZHVI), a smoothed measure of typical home values in the 35th to 65th percentile range. Rent estimates use the Zillow Observed Rent Index (ZORI). Population figures come from the U.S. Census Bureau Population Estimates Program (2020-2024 vintage). All datasets are publicly available. Housing data updated 2026-02-28.