Manassas Home Prices: $552K, Up 0.9% — 4 ZIPs Analyzed (2026)
$551,863. That’s what a typical home costs in Manassas, VA right now. Prices are up 0.9% compared to a year ago — barely keeping pace with inflation. For a city inside the Washington, DC metro area, that number tells an interesting story about where value still exists in Northern Virginia.
Quick answer: The average home price in Manassas, VA is $551,863 as of February 2026, up 0.9% year over year according to Zillow.
Current Home Prices in Manassas
Here’s the snapshot for February 2026:
| Metric | Value |
|---|---|
| Median Home Value | $551,863 |
| Year-over-Year Change | +0.9% |
| Lowest ZIP Median | $451,630 |
| Highest ZIP Median | $732,926 |
| ZIP Codes Tracked | 4 |
A 0.9% annual gain is flat by DC-area standards. The gap between the cheapest and most expensive ZIP is $281,296 — a spread that shows Manassas isn’t one market. It’s at least two.
The city sits in the Washington-Arlington-Alexandria metro, where prices in closer-in suburbs like Arlington and Fairfax run much higher. Manassas offers a discount for the commute trade-off, and the data suggests buyers have noticed. Prices haven’t dropped, but the growth rate has cooled to under 1%.
For buyers, that’s not bad news. It means you’re not chasing a runaway market. For sellers, it means pricing needs to be sharp — overpriced listings will sit.
Manassas Home Prices by Neighborhood
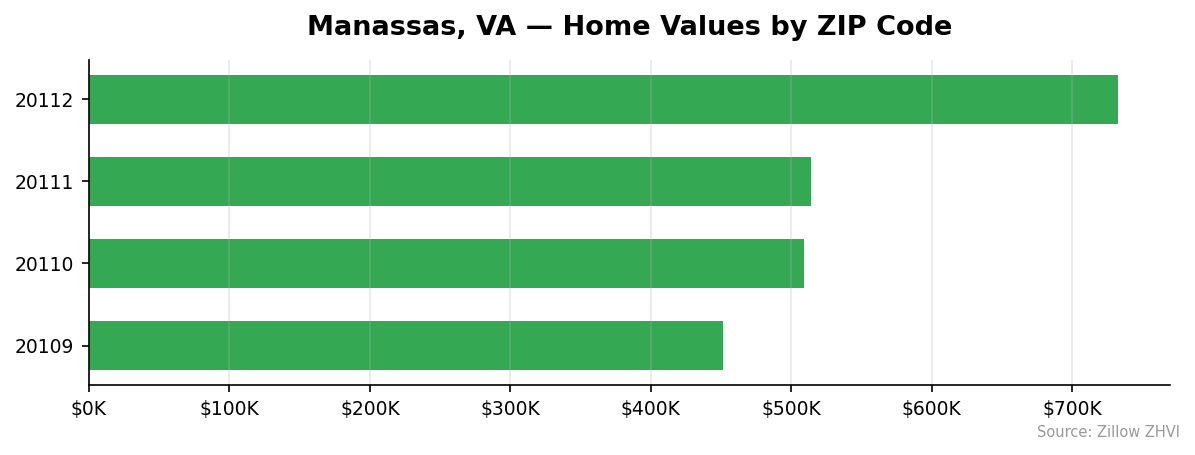
All four Manassas ZIP codes, ranked from most to least expensive:
| ZIP Code | Median Home Value | Avg. Rent | vs. City Median |
|---|---|---|---|
| 20112 | $732,926 | Data not available | +33% |
| 20111 | $513,846 | $2,196/mo | -7% |
| 20110 | $509,049 | $2,145/mo | -8% |
| 20109 | $451,630 | $2,116/mo | -18% |
Most Expensive
20112 leads at $732,926, a full 33% above the city median — this is Manassas’s premium pocket, and rent data isn’t available for the area, which may indicate a higher share of owner-occupied homes.
Most Affordable
20109 comes in at $451,630, the only ZIP under $500K in Manassas. Rent here averages $2,116 per month, making it the entry point for both buyers and renters. That’s $281K less than 20112 — enough to buy a second property in some markets.
20110 and 20111 sit in the middle at $509K and $514K respectively. They’re nearly identical in price and rent, separated by less than $5,000 in home value and $51 in monthly rent.
Rent vs Buy in Manassas
Three of Manassas’s four ZIP codes have rent data. Here’s how the numbers compare:
| ZIP Code | Avg. Rent | Est. Mortgage (20% down) |
|---|---|---|
| 20109 | $2,116/mo | ~$2,860/mo |
| 20110 | $2,145/mo | ~$3,220/mo |
| 20111 | $2,196/mo | ~$3,250/mo |
Mortgage estimates assume a 6.5% rate with 20% down, principal and interest only. Add property taxes, insurance, and HOA fees, and the true monthly cost of ownership runs $700–$1,200 more than renting.
The average rent across the three tracked ZIPs is about $2,152 per month. A mortgage on the city median of $552K with 20% down would run roughly $2,790 in principal and interest alone. With taxes and insurance, you’re looking at $3,400 or more.
Renting is cheaper on a monthly basis. But renters build no equity, and with prices up 0.9% year over year, owners gained roughly $5,000 in home value over the past 12 months. The buy decision depends on how long you plan to stay. At this price gap, you’d need to own for several years before buying makes financial sense over renting.
Population Growth and Migration
Manassas had 43,616 residents in 2024, up 2.2% from 42,695 in 2020.
| Year | Population |
|---|---|
| 2020 | 42,695 |
| 2021 | 42,770 |
| 2022 | 42,710 |
| 2023 | 43,087 |
| 2024 | 43,616 |
Growth wasn’t a straight line. The city actually lost residents between 2021 and 2022, dipping to 42,710. Then it picked up — adding 377 people in 2023 and another 529 in 2024. The recent acceleration is noticeable.
How does Manassas compare to other Virginia cities?
| City | 2024 Population | 4-Year Growth |
|---|---|---|
| Suffolk | 103,105 | +8.8% |
| Richmond | 233,655 | +3.0% |
| Manassas | 43,616 | +2.2% |
| Chesapeake | 254,997 | +2.1% |
| Hampton | 137,596 | +0.2% |
| Alexandria | 159,102 | -0.0% |
Manassas is growing faster than Chesapeake and Hampton, but well behind Suffolk’s 8.8% boom. Alexandria, a closer geographic comparison within the DC metro, is essentially flat. That Manassas is adding residents while Alexandria stagnates tells you something about where people are finding value.
More people means more housing demand. At 2.2% population growth and only 0.9% price growth, the market hasn’t fully priced in the new arrivals yet.
Manassas Housing Market Trends
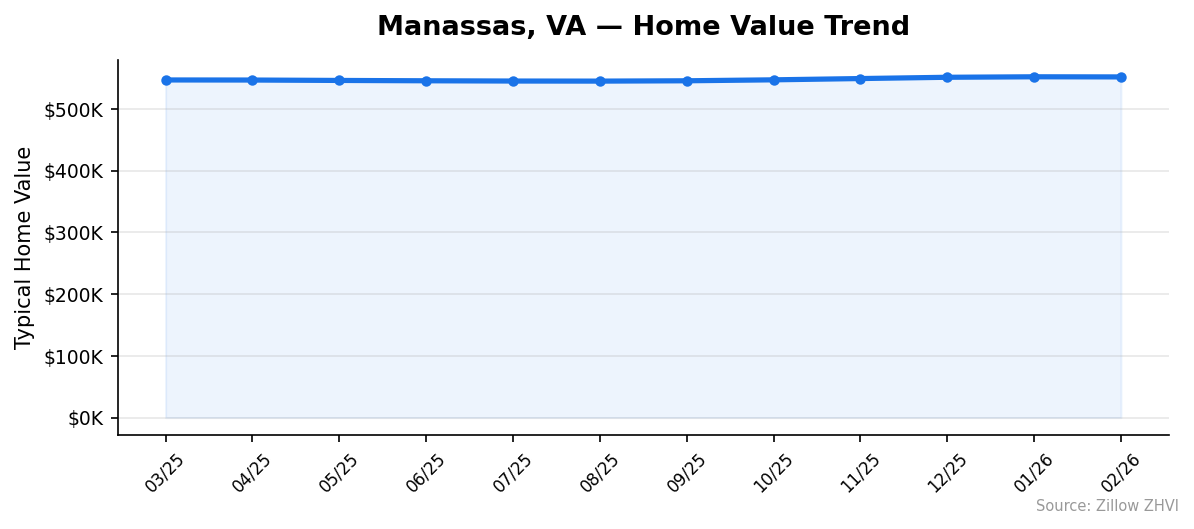
Here’s the month-by-month price movement over the past 12 months:
| Month | Avg. Home Value | Monthly Change |
|---|---|---|
| Feb 2026 | $551,863 | -$211 |
| Jan 2026 | $552,074 | +$786 |
| Dec 2025 | $551,288 | +$2,079 |
| Nov 2025 | $549,209 | +$2,063 |
| Oct 2025 | $547,146 | +$1,549 |
| Sep 2025 | $545,597 | +$529 |
| Aug 2025 | $545,068 | -$122 |
| Jul 2025 | $545,190 | -$419 |
| Jun 2025 | $545,609 | -$544 |
| May 2025 | $546,153 | -$662 |
| Apr 2025 | $546,815 | -$120 |
| Mar 2025 | $546,935 | — |
The pattern is clear. Prices drifted down from March through August 2025, bottoming around $545K. Then they reversed — climbing steadily from September through January 2026. February showed a tiny $211 dip, which could be seasonal noise.
The trough-to-peak move was about $7,000, or 1.3%. Not dramatic, but the direction shifted decisively in fall 2025.
Is Manassas a Good Place to Buy in 2026?
The data points to a stable market, not a hot one. Prices are up less than 1% year over year. Monthly gains have been small — $500 to $2,000 at best. There’s no bidding frenzy here.
For buyers, that’s favorable. You have negotiating room. The $281K spread between the cheapest ZIP (20109 at $452K) and the priciest (20112 at $733K) means you can find entry points at well below the city median.
For sellers, the flat growth means you won’t get windfall gains by waiting. If you’re thinking of listing, pricing accurately matters more than timing.
Manassas sits at a sweet spot in the DC metro — far enough out for lower prices, close enough for commuters. The 2.2% population growth suggests people agree. At $552K, it’s not cheap in absolute terms, but for the Washington area, it’s one of the more accessible options.
Manassas Housing Market Outlook for 2026-2027
The three-month trend from December 2025 through February 2026 shows prices leveling off around $551K–$552K. The strong gains of October and November have slowed.
If the current pace continues, expect prices to hover in the $550K–$555K range through mid-2026. The seasonal pattern from 2025 — dipping in spring/summer, then rising in fall — could repeat. That would put a potential low near $548K in summer and a push toward $555K by year-end.
None of this suggests a crash or a surge. Manassas is in a holding pattern, which favors patient buyers who can wait for the right property rather than rushing to beat price increases.
Similar Markets in VA
If you’re exploring Northern Virginia and beyond, these cities offer useful comparisons:
- Woodbridge — Manassas’s neighbor along the I-95 corridor, another option for DC commuters seeking lower prices.
- Fairfax — Closer to DC with likely higher prices, a good benchmark for what the Manassas discount gets you.
- Fredericksburg — Further south, typically more affordable, for buyers willing to extend the commute.
- Arlington — The premium end of Northern Virginia, useful for understanding the ceiling.
- Chesapeake — Similar population growth rate to Manassas but in the Hampton Roads area, a different market entirely.
Frequently Asked Questions
What is the average home price in Manassas?
The average home price in Manassas is $551,863 as of February 2026. Prices range from $451,630 in ZIP code 20109 to $732,926 in ZIP code 20112. The city-wide median has held steady near $550K for the past several months.
Are home prices going up or down in Manassas?
Prices are up 0.9% year over year. On a monthly basis, values climbed from a low of $545,068 in August 2025 to $552,074 in January 2026 before dipping slightly in February. The overall direction is up, but the pace is slow.
Is it cheaper to rent or buy in Manassas?
Renting is cheaper on a monthly basis. Average rent across tracked ZIPs is about $2,152, while a mortgage on the median home with 20% down runs roughly $3,400+ including taxes and insurance. That’s a gap of over $1,200 per month. Buying makes more sense if you plan to stay five or more years.
What is the most affordable neighborhood in Manassas?
ZIP code 20109 is the most affordable at $451,630 — about 18% below the city median. Rent there averages $2,116 per month, also the lowest in the city. It’s the clear entry point for budget-conscious buyers.
Methodology
Home values are based on the Zillow Home Value Index (ZHVI), a smoothed measure of typical home values in the 35th to 65th percentile range. Rent estimates use the Zillow Observed Rent Index (ZORI). Population figures come from the U.S. Census Bureau Population Estimates Program (2020-2024 vintage). All datasets are publicly available. Housing data updated 2026-02-28.