Woodbridge Home Prices: $502K, Up 0.3% — 3 ZIPs Analyzed (2026)
$501,919. That’s what a typical home costs in Woodbridge, VA right now. Prices are up just 0.3% from a year ago — barely keeping pace with inflation. For a Northern Virginia suburb inside the D.C. metro, that number tells a story of a market that has gone flat.
Quick answer: The average home price in Woodbridge, VA is $501,919 as of February 2026, up 0.3% year over year according to Zillow.
Current Home Prices in Woodbridge
Here’s where the Woodbridge market stands right now:
| Metric | Value |
|---|---|
| Median Home Value | $501,919 |
| Year-over-Year Change | +0.3% |
| Lowest ZIP Median | $482,608 |
| Highest ZIP Median | $519,575 |
| Number of ZIP Codes | 3 |
| Data As Of | February 2026 |
A 0.3% annual gain is essentially stagnant. Compare that to the broader Washington-Arlington-Alexandria metro, where prices have historically climbed faster. Woodbridge sits just above the half-million mark, which puts it in a tricky spot — expensive enough to stretch budgets, but not appreciating fast enough to build quick equity.
The spread between the cheapest and most expensive ZIP codes is about $37,000. That’s a relatively tight range, meaning Woodbridge doesn’t have the dramatic neighborhood-by-neighborhood price swings you see in larger cities.
For buyers, the flat growth is a double-edged sword. You’re not competing against rapidly rising prices. But you’re also not guaranteed the kind of appreciation that makes homeownership feel like a sure bet.
Woodbridge Home Prices by Neighborhood
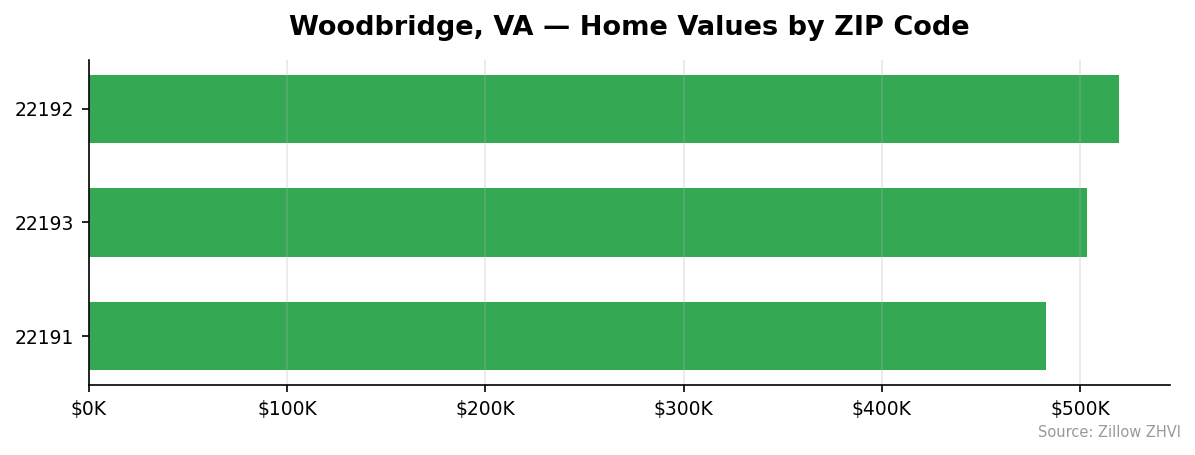
Woodbridge has three ZIP codes, and the price differences are modest but worth knowing.
| ZIP Code | Median Home Value | Average Rent |
|---|---|---|
| 22191 | $482,608 | $2,181/mo |
| 22192 | $519,575 | $2,145/mo |
| 22193 | $503,573 | $2,119/mo |
Most Expensive
22192 leads at $519,575 — about $17,600 above the city average. Despite the higher home prices, rent here actually runs mid-pack at $2,145 per month, which suggests owners are absorbing more of the cost premium than landlords are passing along.
Most Affordable
22191 comes in at $482,608, roughly $19,300 below the city average. Interestingly, it has the highest average rent of the three ZIPs at $2,181 per month. That gap between low purchase prices and high rents makes 22191 worth a closer look for investors.
22193 sits right in the middle at $503,573 and has the lowest rents at $2,119 per month.
Rent vs Buy in Woodbridge
The average rent across Woodbridge’s three ZIP codes comes out to about $2,148 per month.
Now compare that to buying. On a $501,919 home with 20% down ($100,384), you’d finance roughly $401,535. At a 7% mortgage rate over 30 years, the principal and interest payment alone runs about $2,671 per month. Add property taxes, homeowner’s insurance, and maintenance, and the true monthly cost of ownership pushes well past $3,000.
| Cost | Monthly |
|---|---|
| Average Rent | $2,148 |
| Mortgage (P&I, 20% down, 7%) | ~$2,671 |
| Estimated Total Ownership Cost | ~$3,200+ |
Renting saves you roughly $500-$1,000 per month in cash flow. With prices growing at just 0.3% annually, the equity argument is weak right now. You’d gain about $1,500 in home value over a year — far less than the extra monthly cost of owning.
That math changes if mortgage rates drop. At 6%, the P&I payment falls to about $2,407, narrowing the gap significantly. But at today’s rates, renting is the cheaper option in Woodbridge by a clear margin.
Woodbridge Housing Market Trends
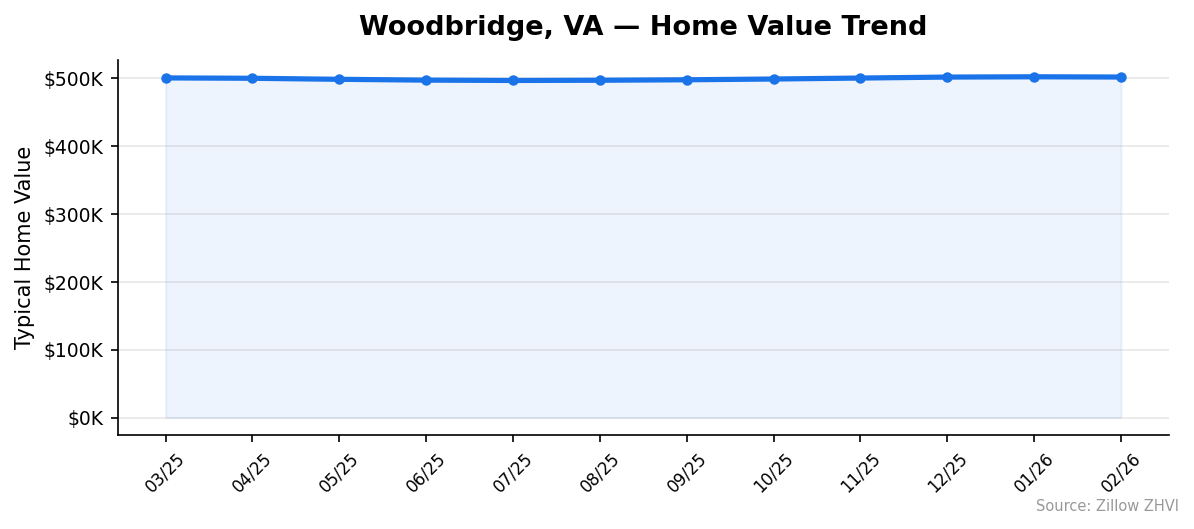
Here’s how prices have moved over the past 12 months:
| Month | Median Value | Min ZIP | Max ZIP |
|---|---|---|---|
| Feb 2026 | $501,919 | $482,608 | $519,575 |
| Jan 2026 | $502,282 | $483,077 | $519,916 |
| Dec 2025 | $501,858 | $482,624 | $519,670 |
| Nov 2025 | $500,417 | $481,131 | $518,231 |
| Oct 2025 | $499,006 | $479,583 | $516,848 |
| Sep 2025 | $497,871 | $478,376 | $515,643 |
| Aug 2025 | $497,186 | $477,595 | $515,210 |
| Jul 2025 | $496,851 | $477,209 | $515,165 |
| Jun 2025 | $497,366 | $477,564 | $516,069 |
| May 2025 | $498,569 | $478,560 | $517,539 |
| Apr 2025 | $500,086 | $479,829 | $519,167 |
| Mar 2025 | $500,620 | $480,161 | $519,706 |
The pattern here is a shallow U-shape. Prices started around $500,600 in March 2025, dipped to a low of $496,851 in July, then climbed back to $501,919 by February 2026. The total swing from bottom to top was about $5,000 — just 1% of the home value.
Since the July bottom, prices have risen for seven straight months. But the pace has slowed. The jump from October to November was $1,411. From January to February, prices actually dipped $363.
That January-to-February pullback is small but worth watching. It may signal the recovery from the summer dip is running out of steam.
Is Woodbridge a Good Place to Buy in 2026?
The data points to a balanced market. Prices aren’t running away from buyers, and they aren’t falling either. A 0.3% annual gain means sellers have no real bargaining power to demand above-ask prices.
For first-time buyers in the D.C. metro, Woodbridge offers a way into the market below the region’s higher-priced suburbs like Arlington and Fairfax. You get a home for around $500K instead of $700K+.
The risk: you won’t build equity quickly at this growth rate. If you plan to stay five or more years, the slow appreciation matters less — you’re paying down principal and locking in housing costs. If you’re looking for a two-year flip, the numbers don’t support it.
Renters should think hard about timing. With rents averaging $2,148 and ownership costs above $3,000, there’s no urgency to buy unless rates drop meaningfully.
Woodbridge Housing Market Outlook for 2026-2027
The three-month trend from December through February shows prices hovering in a tight $400 range — $501,858 to $502,282. That’s about as flat as a market gets.
If the current pace continues, expect Woodbridge home values to stay in the $500K to $505K range through mid-2026. The summer months historically see slightly more activity, which could push prices toward the upper end of that band.
There’s no momentum suggesting a breakout above $510K or a correction below $495K based on the available data. The market appears to be in a holding pattern, likely waiting for a shift in mortgage rates to move meaningfully in either direction.
For buyers watching from the sidelines, the lack of urgency is actually useful. You have time to shop without fear of prices jumping $20K between offers.
Similar Markets in VA
If you’re exploring the Northern Virginia and broader Virginia market, these cities offer useful comparisons:
- Virginia Beach — A coastal market with different price drivers than the D.C. suburbs.
- Fairfax — Closer to D.C. and typically pricier than Woodbridge, worth comparing for the premium you’d pay.
- Arlington — The high end of Northern Virginia, useful as a ceiling benchmark.
- Manassas — Woodbridge’s neighbor and a natural alternative for buyers priced out of closer-in suburbs.
- Fredericksburg — Further south along I-95, often cheaper, with a longer commute tradeoff.
Frequently Asked Questions
What is the average home price in Woodbridge?
The average home price in Woodbridge, VA is $501,919 as of February 2026. Prices range from $482,608 in ZIP code 22191 to $519,575 in 22192. The city sits within the Washington-Arlington-Alexandria metro area.
Are home prices going up or down in Woodbridge?
Prices are up 0.3% year over year — essentially flat. After dipping to $496,851 in July 2025, values recovered through the fall and winter. The market has stabilized around the $502K mark over the last three months.
Is it cheaper to rent or buy in Woodbridge?
Renting is cheaper right now. The average rent across Woodbridge is about $2,148 per month. A mortgage on the median home with 20% down at 7% runs roughly $2,671 in principal and interest alone, before taxes and insurance.
What is the most affordable neighborhood in Woodbridge?
ZIP code 22191 has the lowest median home value at $482,608, about $19,300 below the city average. It also has the highest average rent at $2,181 per month, which makes it an interesting option for investors looking at rental yield.
Methodology
Home values are based on the Zillow Home Value Index (ZHVI), a smoothed measure of typical home values in the 35th to 65th percentile range. Rent estimates use the Zillow Observed Rent Index (ZORI). Population figures come from the U.S. Census Bureau Population Estimates Program (2020-2024 vintage). All datasets are publicly available. Housing data updated 2026-02-28.