Chesterfield Home Prices: $426K, Up 2% — 3 ZIPs Analyzed (2026)
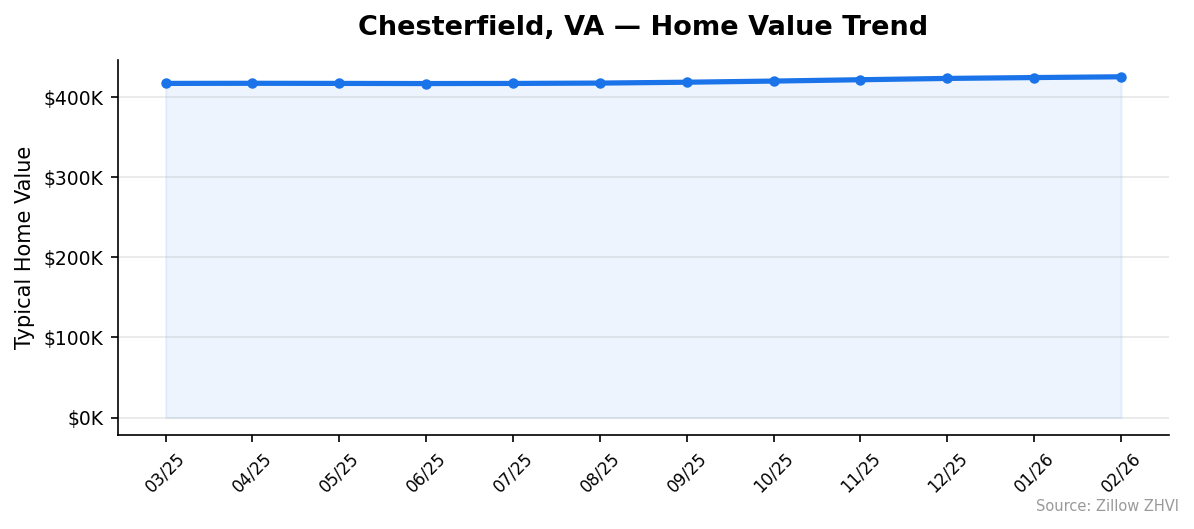
$425,541. That’s the typical home price in Chesterfield, VA as of February 2026 — up 2.0% from a year ago. The market has crept up every month since June 2025, but the pace is slow.
Quick answer: The average home price in Chesterfield, VA is $425,541 as of February 2026, up 2.0% year over year according to Zillow.
Current Home Prices in Chesterfield
The Chesterfield housing market sits in the middle of Virginia’s price spectrum. Not cheap. Not Northern Virginia expensive either. The data shows a market that’s gaining ground without sprinting.
| Metric | Value |
|---|---|
| Median home value | $425,541 |
| Year-over-year change | +2.0% |
| Lowest ZIP median | $319,950 |
| Highest ZIP median | $552,801 |
| ZIP codes tracked | 3 |
| Data through | February 2026 |
| Metro area | Richmond, VA |
The spread between Chesterfield’s cheapest and priciest ZIPs is $232,851. That’s wide. A buyer with a $325K budget and a buyer with $550K are both shopping the same county — just different sides of it.
The 2.0% annual gain comes in below the typical national pace. For a homeowner, that means modest equity growth. For a buyer, it means the window isn’t slamming shut.
Twelve months ago the median sat near $417,000. Today it’s $425,541. That’s an $8,500 lift — roughly $700 a month in added value. Steady, not stunning.
You won’t find dramatic price swings here. The min ZIP value moved from $313,196 last March to $319,950 in February. The max ZIP went from $540,087 to $552,801. Both ends of the market moved in the same direction at roughly the same pace.
That kind of synchronized growth tells you the demand is broad-based, not driven by one hot pocket. The whole county is appreciating at a similar clip.
Chesterfield Home Prices by Neighborhood
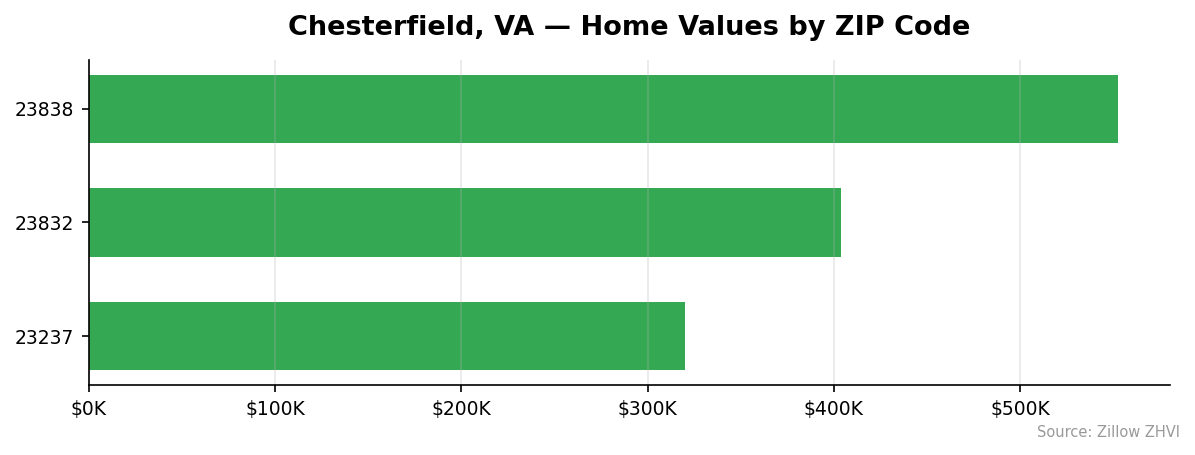
Three ZIP codes anchor the Chesterfield market. They tell three different stories about price.
| ZIP Code | Median Home Value | Median Rent |
|---|---|---|
| 23838 | $552,801 | Not available |
| 23832 | $403,874 | $1,769 |
| 23237 | $319,950 | $1,833 |
Most Expensive
23838 — $552,801. This ZIP runs 30% above the city median and is the only Chesterfield area where typical homes clear the half-million mark. It’s the price ceiling for the county.
Most Affordable
23237 — $319,950. This is the entry point. Homes here cost about 25% less than the city median, and the rent ($1,833) is the highest tracked locally — a sign of strong tenant demand relative to home values.
23832 — $403,874. The middle ZIP, sitting just under the city average. Rent here runs $1,769, the lowest of the two ZIPs with rent data.
The pattern: the cheaper the home, the higher the relative rent. That makes 23237 the strongest cash-flow ZIP for investors, while 23838 is built for owner-occupants who want appreciation and space.
Rent vs Buy in Chesterfield
Rent data covers two of the three ZIPs. Median rent runs between $1,769 and $1,833 per month — call it $1,800 as a working number.
Now the buy side. A $425,541 home with 20% down ($85,108) leaves a $340,433 mortgage. At 7% on a 30-year fixed, principal and interest comes to about $2,265 a month. Add property tax (Chesterfield County’s effective rate is roughly 0.8%, or $284/month) and insurance (~$120/month). Total monthly outlay: about $2,670 — before maintenance.
Renting at $1,800 saves you $870 a month on cash flow. Over a year, that’s $10,440 in your pocket instead of going to the bank.
Buying makes sense if you stay long enough to recover the $85,108 down payment plus closing costs through equity and appreciation. At 2% annual price growth, your $425,541 home gains $8,511 in year one. Add roughly $4,000 in principal paydown. That’s $12,511 in equity per year — about $1,043 a month.
So owning costs $870 more a month in cash, but builds $1,043 a month in equity. Break-even on cash flow takes about 7-8 years once you factor in transaction costs.
If you’re staying under 5 years, rent. If you’re staying 7+, the math tilts toward buying.
Chesterfield Housing Market Trends
Twelve months of data. The direction is consistently up, but the pace shifted.
| Month | Median Value | Month-over-Month |
|---|---|---|
| Feb 2026 | $425,541 | +0.22% |
| Jan 2026 | $424,589 | +0.26% |
| Dec 2025 | $423,502 | +0.39% |
| Nov 2025 | $421,866 | +0.40% |
| Oct 2025 | $420,199 | +0.34% |
| Sep 2025 | $418,757 | +0.26% |
| Aug 2025 | $417,682 | +0.10% |
| Jul 2025 | $417,246 | +0.03% |
| Jun 2025 | $417,104 | -0.04% |
| May 2025 | $417,276 | -0.03% |
| Apr 2025 | $417,418 | +0.03% |
| Mar 2025 | $417,278 | — |
Spring and early summer 2025 were flat. Prices barely moved between March and July. Then growth picked up.
From August through November, the monthly gain accelerated from 0.10% to 0.40%. That’s the second half of 2025 doing the heavy lifting on the annual number.
The most recent two months show deceleration. December posted +0.39%, January +0.26%, February +0.22%. The trend is still positive but the foot is easing off the gas.
Over the full 12 months, prices added $8,263. Three-quarters of that gain came after July.
Is Chesterfield a Good Place to Buy in 2026?
The market favors sellers slightly, but not aggressively. A 2.0% annual price gain is healthy without being a bidding-war signal.
The case for buying: prices have risen 11 months straight. The ZIP price floor at $319,950 still gives entry-level buyers an option below the regional average. Rent in 23237 is high enough relative to home values to support investor activity, which usually props up demand.
The case for waiting: the monthly growth rate is decelerating. February’s 0.22% is roughly half of November’s 0.40%. If that pattern continues, annual gains could cool further into 2026.
Affordability across the three ZIPs varies enough that a $100K budget difference moves you between very different neighborhoods. That gives buyers room to match price to need without leaving the county.
Verdict: it’s a buyer’s market for anyone with a 5+ year horizon and a clear ZIP preference. It’s a hold-not-rush market for everyone else.
Chesterfield Housing Market Outlook for 2026-2027
The 3-month trend shows monthly gains slowing — from 0.40% in November to 0.22% in February. If the current pace continues, annual appreciation in 2026 will likely come in below the 2.0% mark posted through February.
The 6-month trend is more bullish. From August 2025 through February 2026, prices gained 1.9% in just half a year. That’s a 3.8% annualized run rate.
These two signals point in different directions. The recent slowdown could be a winter pause, or it could be the start of a flatter cycle.
A reasonable read: prices stay positive through the next 3-6 months but the annual gain compresses. The high ZIP at $552,801 has the most room to wobble if mortgage rates stay above 6.5%. The low ZIP at $319,950 is more rate-resilient because it serves first-time buyers who keep returning to the market.
Similar Markets in VA
- Henrico — Same Richmond metro, often compared directly with Chesterfield by buyers weighing both counties.
- Midlothian — Adjacent suburban market with overlap in school districts and commute patterns.
- Fredericksburg — Northern alternative for buyers willing to trade Richmond proximity for I-95 access to DC.
- Virginia Beach — Coastal pivot for buyers comparing inland Richmond pricing to Hampton Roads.
- Chesapeake — Another Hampton Roads option for shoppers weighing similar mid-priced Virginia markets.
Frequently Asked Questions
What is the average home price in Chesterfield?
The average home price in Chesterfield, VA is $425,541 as of February 2026. The figure is the median across three ZIP codes tracked by Zillow’s Home Value Index. The range runs from $319,950 in ZIP 23237 to $552,801 in ZIP 23838.
Are home prices going up or down in Chesterfield?
Prices are up 2.0% year over year. The median climbed from about $417,000 in March 2025 to $425,541 in February 2026 — a gain of roughly $8,500. Monthly increases have slowed in early 2026 but the direction remains positive.
Is it cheaper to rent or buy in Chesterfield?
Renting is cheaper on a monthly cash basis. Median rent runs about $1,800 versus an estimated $2,670 monthly cost to own the median home with 20% down at current rates. Buying builds equity, but break-even versus renting takes about 7-8 years.
What is the most affordable neighborhood in Chesterfield?
ZIP 23237 is the cheapest, with a median home value of $319,950 — about 25% below the citywide median. It also has the highest median rent of the tracked ZIPs at $1,833 per month, which suggests strong tenant demand relative to home prices.
Methodology
Home values are based on the Zillow Home Value Index (ZHVI), a smoothed measure of typical home values in the 35th to 65th percentile range. Rent estimates use the Zillow Observed Rent Index (ZORI). Population figures come from the U.S. Census Bureau Population Estimates Program (2020-2024 vintage). All datasets are publicly available. Housing data updated 2026-02-28.