Kentwood Home Prices: $355K, Up 3.6% — 4 ZIPs Analyzed (2026)
$354,754. That is what a typical home costs in Kentwood, MI as of February 2026. Prices are up 3.6% from a year ago, and the line on the 12-month chart has not dropped once.
Quick answer: The average home price in Kentwood, MI is $354,754 as of February 2026, up 3.6% year over year.
Current Home Prices in Kentwood
The typical Kentwood home sits at $354,754. A year ago it was closer to $342,263. That is a gain of roughly $12,500 in 12 months.
The range across the city’s four ZIP codes is wide. The cheapest neighborhood averages $244,594. The priciest pushes past $488,000. That spread — nearly $244,000 between the top and bottom ZIP — tells you Kentwood is not a single market. It is several.
| Metric | Value |
|---|---|
| Median home value | $354,754 |
| Year-over-year change | +3.6% |
| Lowest ZIP average | $244,594 |
| Highest ZIP average | $488,723 |
| ZIP codes tracked | 4 |
| Data month | February 2026 |
| Metro area | Grand Rapids-Kentwood, MI |
The 3.6% yearly gain lands Kentwood in growth territory. Prices climbed every month over the past year — no dips, no plateaus. The city sits inside the Grand Rapids-Kentwood metro, which has seen steady demand since the pandemic-era run-up cooled in many other Midwestern markets.
For buyers, the math is tighter than last year. A home that cost $342,263 in March 2025 now costs $12,491 more. At a 7% mortgage rate, that extra cost adds roughly $83 to a monthly payment — before taxes and insurance.
Kentwood Home Prices by Neighborhood
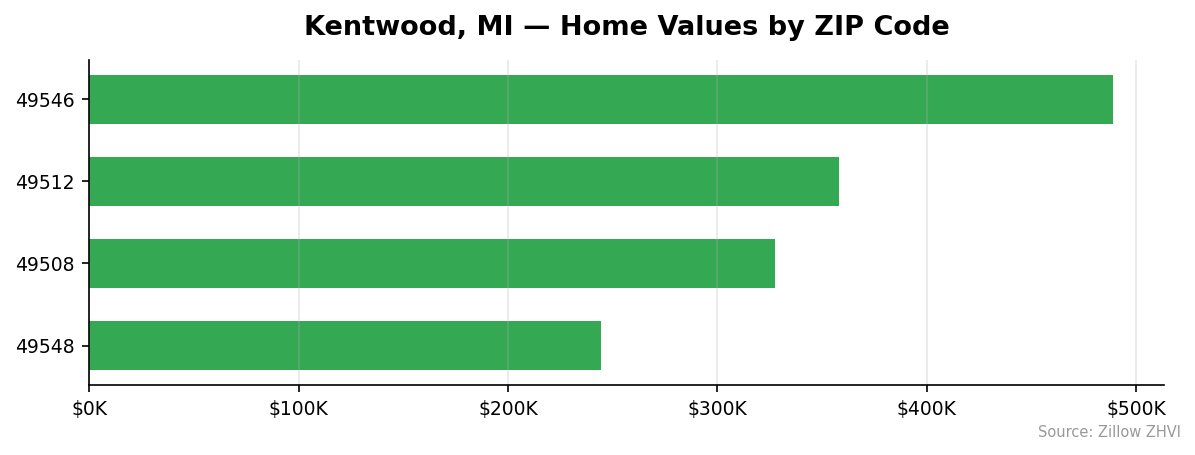
Four ZIP codes make up Kentwood. The gap between them is the story.
| ZIP Code | Average Home Value | Average Rent |
|---|---|---|
| 49546 | $488,723 | $1,894 |
| 49512 | $358,205 | $1,651 |
| 49508 | $327,493 | $1,922 |
| 49548 | $244,594 | Data not available |
Most Expensive
- 49546 — $488,723. The most expensive ZIP in the city, sitting 38% above the Kentwood average. Rents here average $1,894 a month, similar to cheaper areas, which suggests buyers pay a premium for ownership here that renters do not.
- 49512 — $358,205. Just above the citywide median. Rents are the lowest of the three ZIPs with data at $1,651.
- 49508 — $327,493. Slightly below the city average and paired with the highest rent at $1,922, making it a weaker rent-to-price ratio for landlords.
Most Affordable
- 49548 — $244,594. The cheapest ZIP in Kentwood by a wide margin, 31% below the citywide average and roughly half the price of 49546.
- 49508 — $327,493. Below the median, and the only sub-$330K ZIP outside 49548.
- 49512 — $358,205. Near the city average — affordable compared to 49546 but well above 49548.
Rent vs Buy in Kentwood
Rent in Kentwood runs $1,651 to $1,922 a month depending on which ZIP you pick. The average across the three ZIPs with rent data is about $1,822.
Now the buy side. On a $354,754 home with 20% down ($70,951) and a 30-year mortgage at 7%, the principal and interest alone come to roughly $1,890 a month. Add property taxes (Michigan averages around 1.3% of assessed value) and homeowners insurance, and the monthly cost lands closer to $2,400.
So renting is cheaper on a month-to-month basis. By about $500 to $600.
That gap does not account for equity. A buyer putting down $70,951 and watching the home appreciate 3.6% a year gains roughly $12,500 in paper value annually. A renter does not. Over a five-year stretch of similar appreciation, the buy-side math looks different — but only if you stay put.
If you need flexibility, rent wins today. If you plan to stay five-plus years and can absorb the higher monthly, buying has a case. The cheapest rent is in 49512 at $1,651, and the highest is in 49508 at $1,922. Renting a 49508 unit at $1,922 costs $23,064 a year. Buying the median home costs about $28,800 a year before equity.
Population Growth and Migration
Kentwood had 54,768 residents in 2024. That is up from 54,266 in 2020, a 0.9% gain over four years.
The city dipped slightly in 2021 and 2022 before rebounding. The jump from 54,246 in 2023 to 54,768 in 2024 was the biggest single-year move.
| Year | Population |
|---|---|
| 2020 | 54,266 |
| 2021 | 54,193 |
| 2022 | 54,118 |
| 2023 | 54,246 |
| 2024 | 54,768 |
Compared to other Michigan cities, Kentwood’s growth is middle of the pack.
| City | 2024 Population | 4-Year Growth |
|---|---|---|
| Troy | 89,209 | +2.4% |
| Lansing | 114,336 | +1.6% |
| Detroit | 645,705 | +1.1% |
| Kentwood | 54,768 | +0.9% |
| Grand Rapids | 200,117 | +0.7% |
| Farmington Hills | 84,173 | +0.4% |
Kentwood adds residents faster than Grand Rapids next door. That matters for housing. More people competing for the same 4 ZIP codes puts upward pressure on prices — which lines up with the 3.6% gain the data shows.
Kentwood Housing Market Trends
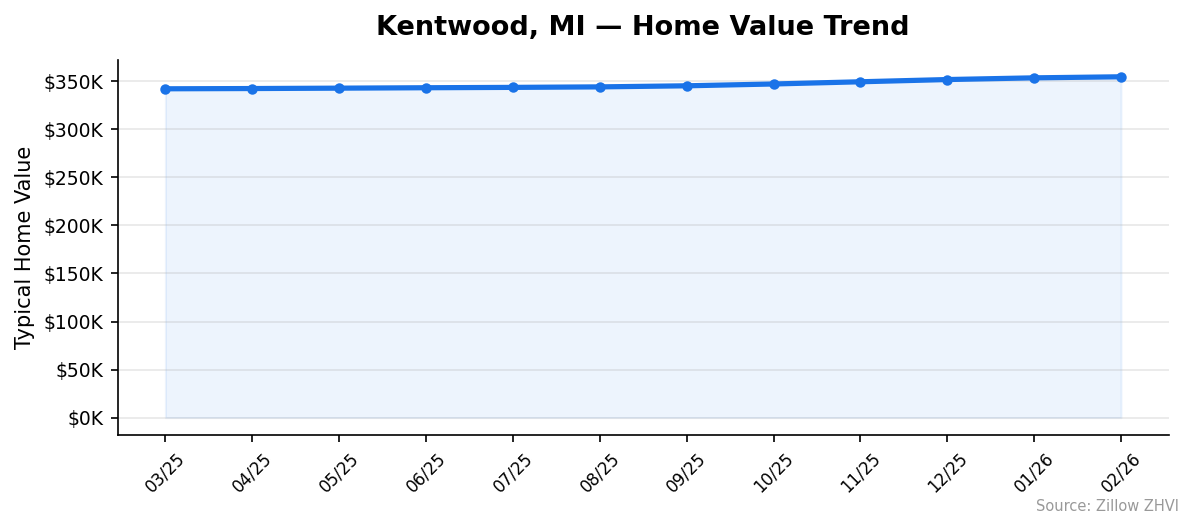
The 12-month trend is a straight line up. No monthly decline. No flat stretch.
| Month | Average Value |
|---|---|
| Feb 2026 | $354,754 |
| Jan 2026 | $353,659 |
| Dec 2025 | $351,881 |
| Nov 2025 | $349,559 |
| Oct 2025 | $347,268 |
| Sep 2025 | $345,366 |
| Aug 2025 | $344,251 |
| Jul 2025 | $343,727 |
| Jun 2025 | $343,358 |
| May 2025 | $342,920 |
| Apr 2025 | $342,526 |
| Mar 2025 | $342,263 |
The pace picked up in the second half of the period. Spring and early summer 2025 saw monthly gains of roughly $400 to $500. By late fall, the city was adding over $2,000 a month. December to January jumped $1,778. January to February added another $1,095.
That late-year acceleration is worth watching. Prices moved 0.8% in just the last three months. If that rate held for a full year, it would work out to about 3.3% annual growth — roughly where the current YoY sits, give or take.
Is Kentwood a Good Place to Buy in 2026?
The data points to a seller’s market. Prices are up 3.6% year over year with no monthly declines. Population is growing. Four ZIPs and rising demand means limited supply.
For buyers, that is not great news on affordability. But it does mean you are buying into a market with momentum rather than one stalling out.
The cheapest entry point is 49548 at $244,594 — a realistic starter-home number in a metro area where the citywide average is $110,000 higher. If your budget is tight, that ZIP is where to look.
For investors, 49508 has the best rent-to-price ratio in the city. At $327,493 with $1,922 monthly rent, the gross yield is around 7% — above what 49546 offers at its much higher price point.
Sellers have the clearer win. Every month has brought higher prices. Holding costs another six months, at the current pace, could mean another $6,000 to $12,000 in value.
Kentwood Housing Market Outlook for 2026-2027
The 3-month trend suggests continued gains. From December 2025 to February 2026, prices added $2,873 — a monthly pace of roughly $958.
If the current pace continues, Kentwood could see another 2% to 3% in price appreciation over the next six months. The momentum is strongest in the higher-priced ZIPs, with 49546 adding more absolute dollars per month than the rest.
The risk is interest rates. A sharp rate move in either direction would reshape the picture. A rate cut could push prices higher faster. A rate hike could stall the climb. The data as it stands shows no signs of weakness — but the data can only tell you where the market has been, not where it is going.
Expect prices to remain above $350,000 through mid-2026 based on current momentum.
Similar Markets in MI
If Kentwood’s $354,754 median is out of reach, here are other Michigan cities worth a look:
- Grand Rapids — the neighboring metro hub, larger and with more ZIP options.
- Lansing — the state capital, typically more affordable than Kentwood.
- Kalamazoo — a smaller West Michigan city with a different price profile.
- Ann Arbor — pricier than Kentwood, driven by the university market.
- Detroit — the largest Michigan market, with a wider range of prices than any other city in the state.
Frequently Asked Questions
What is the average home price in Kentwood?
The average home price in Kentwood, MI is $354,754 as of February 2026. That number reflects Zillow’s Home Value Index across the city’s four ZIP codes and represents a typical home in the 35th to 65th percentile of the local market.
Are home prices going up or down in Kentwood?
Prices are up. Kentwood gained 3.6% over the past year, with the typical home rising from $342,263 in March 2025 to $354,754 in February 2026. The city posted 12 straight months of gains, with the pace picking up in late 2025.
Is it cheaper to rent or buy in Kentwood?
Renting is cheaper on a monthly basis right now. Average rent across Kentwood ZIPs runs $1,651 to $1,922. A mortgage on the median $354,754 home with 20% down costs closer to $2,400 a month once taxes and insurance are included.
What is the most affordable neighborhood in Kentwood?
ZIP 49548 is the most affordable part of Kentwood at $244,594. That is 31% below the citywide average of $354,754 and roughly half the price of the most expensive ZIP, 49546, which averages $488,723.
Methodology
Home values are based on the Zillow Home Value Index (ZHVI), a smoothed measure of typical home values in the 35th to 65th percentile range. Rent estimates use the Zillow Observed Rent Index (ZORI). Population figures come from the U.S. Census Bureau Population Estimates Program (2020-2024 vintage). All datasets are publicly available. Housing data updated 2026-02-28.