Warren Home Prices: $195K, Up 1.8% — 5 ZIPs Analyzed (2026)
$194,643. That’s what a typical home costs in Warren as of February 2026. Prices are up 1.8% from a year ago, but the city itself has lost more than 1,500 residents since 2020.
Quick answer: The average home price in Warren, MI is $194,643 as of February 2026, up 1.8% year over year according to Zillow.
Current Home Prices in Warren
Warren remains one of the most affordable mid-size cities in the Detroit-Warren-Dearborn metro. The typical home costs less than half what you’d pay in Ann Arbor, and the gap to neighboring Sterling Heights is significant too.
| Metric | Value |
|---|---|
| Median home price | $194,643 |
| Year-over-year change | +1.8% |
| Lowest ZIP value | $126,123 (48089) |
| Highest ZIP value | $238,644 (48092) |
| Price spread (low to high) | $112,521 |
| ZIP codes tracked | 5 |
| Data through | Feb 28, 2026 |
The price gap inside Warren is wide. The most expensive ZIP costs almost twice the cheapest one, which tells you the city is not a single market — it’s several.
You’re paying a premium for newer construction and proximity to Sterling Heights on the north side. The older south-side ZIPs sit closer to Detroit’s border and price like it.
A 1.8% gain over 12 months is modest. National home values rose faster over the same period, so Warren is appreciating more slowly than the broader market. That’s typical for the Detroit metro, which has lagged Sun Belt growth for years.
For buyers priced out of Royal Oak or Ferndale, Warren still offers entry-level housing under $130K in some areas. That’s hard to find in southeast Michigan now.
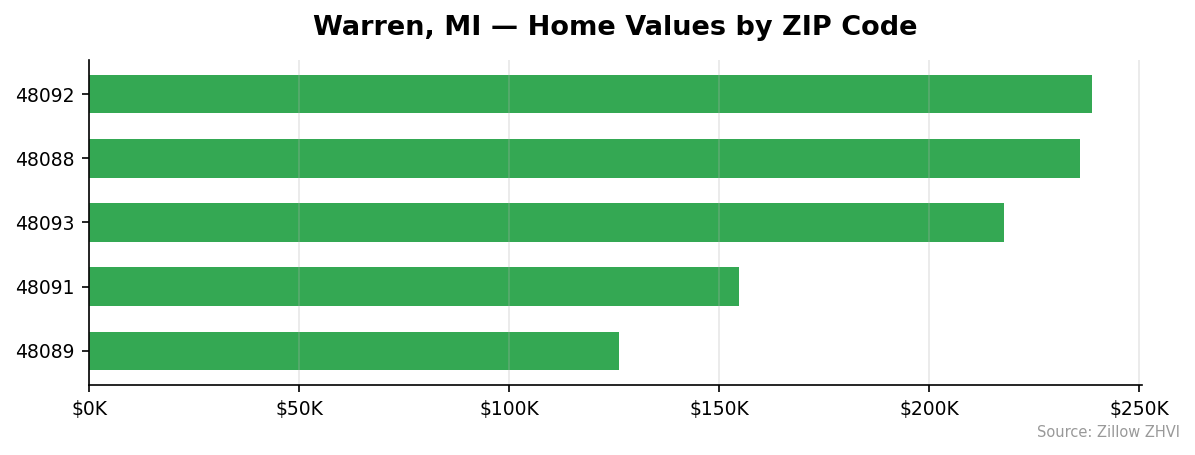
Warren Home Prices by Neighborhood
Five ZIPs, two clear tiers. The northern ZIPs (48092, 48088, 48093) all sit above $215K. The southern ZIPs (48091, 48089) come in well below the city average.
| ZIP | Median Price | vs. City Avg | Median Rent |
|---|---|---|---|
| 48092 | $238,644 | +23% | $1,753 |
| 48088 | $235,898 | +21% | Data not available |
| 48093 | $217,755 | +12% | $1,482 |
| 48091 | $154,797 | -20% | $1,324 |
| 48089 | $126,123 | -35% | $1,288 |
Most Expensive
48092 leads at $238,644 — the highest-rent ZIP too at $1,753, suggesting stronger ownership demand and tighter inventory.
48088 is a close second at $235,898, just $2,746 below the top spot. Rent data isn’t available for this ZIP, but the price level mirrors 48092.
48093 rounds out the top three at $217,755, about 12% above the city average. Rents here are $1,482, lower than 48092 despite home values within $20K.
Most Affordable
48089 is the cheapest at $126,123 — a third below the city average. Rent stays under $1,300, the lowest in Warren.
48091 comes in at $154,797, about 20% below average. Rent here runs $1,324.
48093 also appears in the top three, since Warren has only five tracked ZIPs. At $217,755 it’s the cheapest of the upper tier rather than truly affordable.
Rent vs Buy in Warren
Rent across the four ZIPs with data averages $1,462 a month. The cheapest ZIP rents for $1,288. The most expensive rents for $1,753 — about 36% more.
| ZIP | Median Rent | Median Price | Rent-to-Price (annual) |
|---|---|---|---|
| 48092 | $1,753 | $238,644 | 8.8% |
| 48093 | $1,482 | $217,755 | 8.2% |
| 48091 | $1,324 | $154,797 | 10.3% |
| 48089 | $1,288 | $126,123 | 12.3% |
The cheapest ZIP has the highest rent-to-price ratio. That’s a pattern you see in lower-income neighborhoods across the country — landlords charge a higher percentage of property value because home prices are depressed relative to rental demand.
For a buyer, that ratio matters. A 12.3% gross rental yield in 48089 is the kind of number investors notice. A 8.2% yield in 48093 is closer to what owner-occupiers see in pricier markets.
If you’re choosing between renting and buying in 48089, the math favors buying earlier than it does in 48092. A $126K home at 7% interest with 20% down runs roughly $670 a month in principal and interest — well below the $1,288 rent. Add property taxes and insurance, and you’re still likely under the rent figure.
In 48092, a $238K purchase at the same terms costs about $1,265 in principal and interest, before taxes. With Michigan property taxes added, monthly ownership cost approaches or exceeds the $1,753 rent — a much closer call.
Population Growth and Migration
Warren is losing people. The Census Bureau estimates the population fell from 139,208 in 2020 to 137,686 in 2024.
| Year | Population |
|---|---|
| 2020 | 139,208 |
| 2021 | 138,340 |
| 2022 | 137,274 |
| 2023 | 137,152 |
| 2024 | 137,686 |
The decline isn’t steep — about 1.1% over four years — but the direction is clear. There’s a small uptick in 2024 (+534 residents), which may signal stabilization or just normal year-to-year noise.
Compare that to other Michigan cities:
| City | 2024 Population | 4-Year Growth |
|---|---|---|
| Warren | 137,686 | -1.1% |
| Troy | 89,209 | +2.4% |
| Lansing | 114,336 | +1.6% |
| Detroit | 645,705 | +1.1% |
| Grand Rapids | 200,117 | +0.7% |
| Farmington Hills | 84,173 | +0.4% |
Every nearby city tracked here is growing. Even Detroit, which lost residents for decades, has gained 1.1% since 2020. Warren is the outlier.
What does that mean for housing? Population loss usually softens demand. The fact that Warren’s home values still rose 1.8% suggests the supply side is constrained — fewer new listings and limited new construction — rather than booming demand.
For buyers, that’s a mixed signal. You’re not competing in a market overrun with newcomers, but you’re also not buying into a city adding residents who push values up.
Warren Housing Market Trends
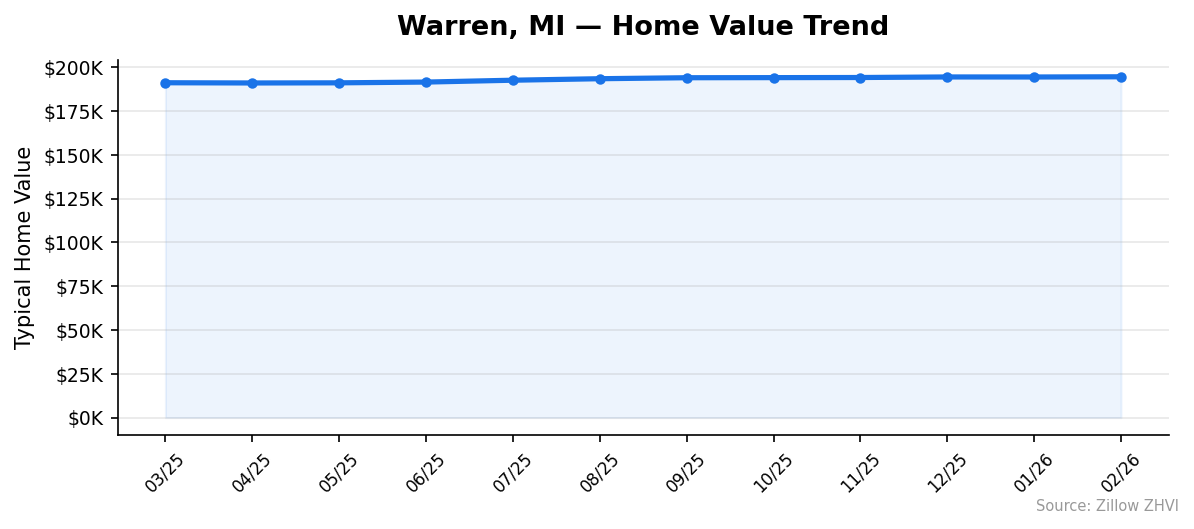
The 12-month price arc has been steady and slow.
| Month | Avg Price | Min ZIP | Max ZIP |
|---|---|---|---|
| Feb 2026 | $194,643 | $126,123 | $238,644 |
| Jan 2026 | $194,525 | $126,041 | $238,898 |
| Dec 2025 | $194,547 | $126,046 | $239,188 |
| Nov 2025 | $194,233 | $125,790 | $239,175 |
| Oct 2025 | $194,165 | $125,607 | $239,339 |
| Sep 2025 | $194,107 | $125,234 | $239,644 |
| Aug 2025 | $193,544 | $124,664 | $239,413 |
| Jul 2025 | $192,688 | $123,927 | $239,044 |
| Jun 2025 | $191,626 | $123,015 | $238,386 |
| May 2025 | $191,191 | $122,525 | $238,309 |
| Apr 2025 | $191,112 | $122,459 | $238,456 |
| Mar 2025 | $191,238 | $122,847 | $238,702 |
From March 2025 to February 2026, the citywide average gained $3,405. That’s about $284 a month — the kind of slow appreciation that won’t make or break a buying decision.
Notice the divergence at the extremes. The minimum ZIP value rose from $122,847 to $126,123 (+2.7%) while the maximum dropped slightly from $238,702 to $238,644. Lower-priced ZIPs are appreciating faster than upper-tier ones.
The recent three months (December, January, February) have been almost flat, hovering between $194,233 and $194,643. Momentum has slowed.
Is Warren a Good Place to Buy in 2026?
The case for buying: home prices remain affordable by national standards. A median under $200K is rare in any major metro. Rent yields favor owners in lower-priced ZIPs. Appreciation, while slow, is positive.
The case against: the city is losing residents. Population trends usually catch up to housing demand eventually. Surrounding cities — Troy, Sterling Heights, Farmington Hills — are growing and outperforming on price growth too.
If you can afford 48092 or 48088, you’re paying for the parts of Warren most insulated from these trends. If you’re buying in 48089 or 48091, you’re getting genuine affordability but in ZIPs where the population pressure is strongest.
For a primary residence with a 5-year horizon, Warren works. The math holds, especially in lower-priced ZIPs. For investment, the rent-to-price ratios in 48089 and 48091 stand out.
It’s not a seller’s market. With prices flat over the past three months and only modest 12-month gains, sellers shouldn’t expect bidding wars.
Warren Housing Market Outlook for 2026-2027
The recent three-month average growth has been roughly flat — values moved less than $500 between December and February. If the current pace continues, you’d expect the citywide median to land somewhere between $195K and $198K by late 2026.
The 12-month trend implies a slightly stronger pace — about 1.8% annualized. If that rate holds, prices could reach $198K-$200K within the next year. The cheaper ZIPs are likely to outpace the citywide average, since they’ve been doing so all year. The most expensive ZIPs may stagnate or drift lower based on the recent micro-pattern.
Population trends are the wildcard. Continued resident loss could flatten appreciation further. The 2024 uptick is worth watching — if it continues, the outlook brightens.
Similar Markets in MI
If Warren’s trade-offs don’t fit, Michigan has plenty of alternatives at different price points:
- Detroit — The metro’s largest city, with home values typically below Warren’s and a population that’s actually growing.
- Sterling Heights — Warren’s larger neighbor to the north, generally pricier but with more new construction.
- Clinton Township — Another Macomb County market, similar in profile to Warren’s upper-tier ZIPs.
- Dearborn — A suburb on Detroit’s west side with comparable mid-range pricing.
- Ann Arbor — A higher-priced, growing university market for buyers willing to spend more.
Frequently Asked Questions
What is the average home price in Warren?
The average home price in Warren, MI is $194,643 as of February 2026. That number reflects the typical mid-tier home value across the city’s five tracked ZIP codes, with the cheapest ZIP at $126,123 and the most expensive at $238,644.
Are home prices going up or down in Warren?
Prices are up 1.8% year over year. From March 2025 to February 2026, the citywide average gained about $3,400, though the most recent three months have been nearly flat — values barely moved between December 2025 and February 2026.
Is it cheaper to rent or buy in Warren?
In the cheapest ZIPs, buying often beats renting. ZIP 48089 has homes at $126,123 with rent averaging $1,288 — a mortgage there typically costs less than rent. In pricier ZIPs like 48092, where homes average $238,644 and rent runs $1,753, the ownership-vs-rent decision is much closer once taxes and insurance are factored in.
What is the most affordable neighborhood in Warren?
ZIP 48089 is the cheapest at $126,123, roughly 35% below the citywide average. It also has the lowest rents at $1,288 a month, suggesting the area attracts both budget-conscious buyers and renters.
Methodology
Home values are based on the Zillow Home Value Index (ZHVI), a smoothed measure of typical home values in the 35th to 65th percentile range. Rent estimates use the Zillow Observed Rent Index (ZORI). Population figures come from the U.S. Census Bureau Population Estimates Program (2020-2024 vintage). All datasets are publicly available. Housing data updated 2026-02-28.