Panama City Home Prices: $259K, Down 2.2% — 3 ZIPs Analyzed (2026)
$259,419. That’s the median home value in Panama City, Florida as of February 2026. Prices are down 2.2% from a year ago, marking a full year of softening after a spring 2025 peak above $265,000.
Quick answer: The average home price in Panama City, FL is $259,419 as of February 2026, down 2.2% year over year according to Zillow.
Current Home Prices in Panama City
The typical Panama City home costs less than a third of the average single-family price in coastal Florida metros like Miami or Naples. The market sits well below the Florida statewide median, which makes the Panhandle one of the more accessible coastal markets in the state.
Here’s what the data shows for February 2026:
| Metric | Value |
|---|---|
| Median home value | $259,419 |
| Year-over-year change | -2.2% |
| Lowest ZIP value | $206,833 |
| Highest ZIP value | $291,294 |
| ZIP codes analyzed | 3 |
| Data through | Feb 28, 2026 |
The spread between the cheapest and most expensive ZIP is about $84,000. That’s a 41% gap from the bottom — meaningful, but tighter than what you’d see in larger Florida metros where neighborhoods can vary by 200% or more.
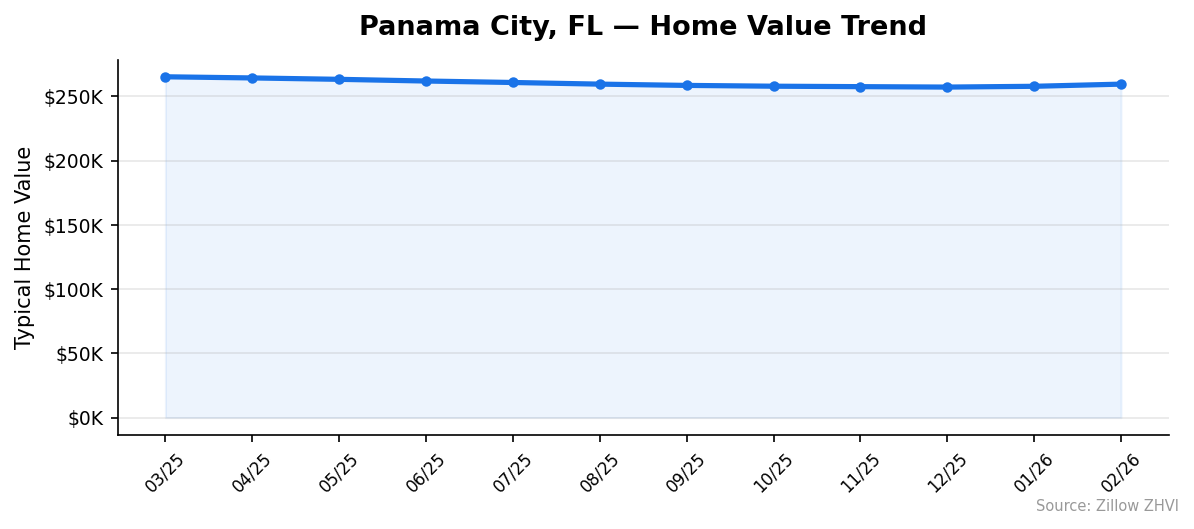
A 2.2% annual decline is modest. It works out to roughly $5,800 less than buyers paid for the same home a year earlier. For context, the city peaked at $265,134 in March 2025 and has lost about 2.1% since.
The decline was steady through summer and fall 2025, then flattened. December’s $257,128 reading was the low point. February 2026 came in at $259,419 — a $2,300 bump over two months. That’s the first sign of stabilization after eleven months of falling prices.
Panama City Home Prices by Neighborhood
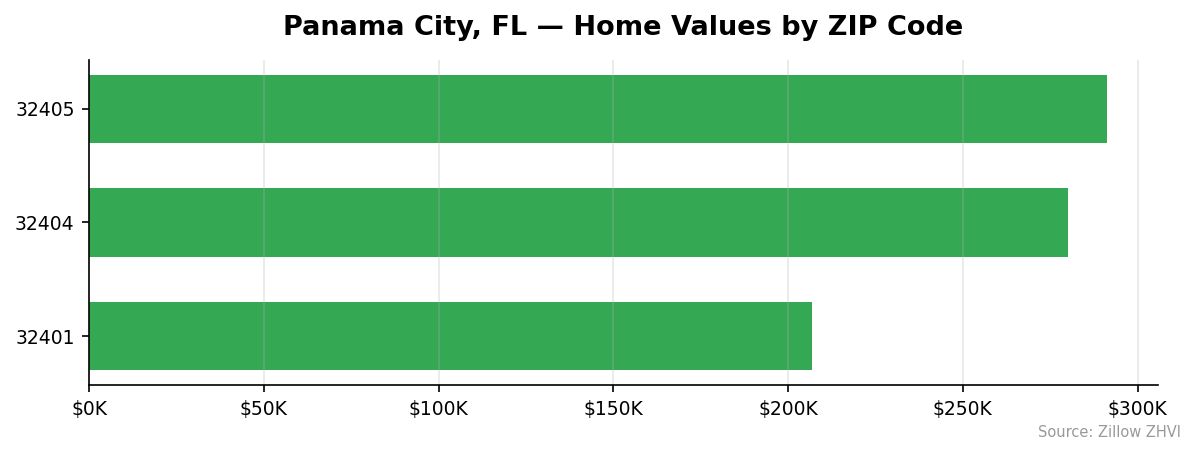
Three ZIP codes make up the city. Two sit above the city average, one sits well below. Here’s how they compare:
| ZIP Code | Typical Home Value | Average Rent | Difference vs City Avg |
|---|---|---|---|
| 32405 | $291,294 | $1,602 | +12.3% |
| 32404 | $280,129 | $1,914 | +8.0% |
| 32401 | $206,833 | $1,563 | -20.3% |
Most Expensive
- 32405 — $291,294. The priciest ZIP in the city, sitting 12% above the local median. Despite the higher home values, rents here are the lowest of the three at $1,602, suggesting a heavier owner-occupied profile.
- 32404 — $280,129. Second-most expensive, but with the highest rents in the city at $1,914 a month. The combination points to stronger rental demand here than in the other ZIPs.
- 32401 — $206,833. Even the cheapest ZIP is technically on this list since there are only three. See below.
Most Affordable
- 32401 — $206,833. The clear bargain, $52,586 below the city median and $84,461 below the most expensive ZIP. Rents are also the lowest at $1,563, making it the most accessible part of Panama City for both buyers and renters.
Rent vs Buy in Panama City
Average rent across the three ZIPs works out to about $1,693 a month. That’s the simple average of $1,914, $1,602, and $1,563.
A typical mortgage on the $259,419 median home tells a different story. Put 20% down ($51,884) and finance $207,535 at 7%. Principal and interest comes to roughly $1,381 a month. Add Florida property taxes near 1% of value ($216 monthly) and homeowner’s insurance — which runs high in Florida coastal counties — at $150 to $250 a month, and the all-in cost lands between $1,747 and $1,847.
So renting saves you about $50 to $150 a month versus buying. That gap excludes maintenance, HOA dues where they apply, and the down payment itself.
The math shifts in 32401, where rent runs $1,563 and the median home costs just $206,833. A 20% down purchase there carries a P&I of about $1,100, with all-in costs near $1,470. Buying actually beats renting in this ZIP by roughly $90 a month — before maintenance.
The picture flips in 32404, where high rents ($1,914) make buying more attractive at the upper end. Buying there runs about $1,860 all-in versus $1,914 for rent.
For most Panama City renters, the rent-or-buy decision is close. The cheaper ZIPs favor buying. The 5% annual price decline over the past year is the bigger risk — a buyer who closed in March 2025 is sitting on roughly $5,700 in lost equity today.
Population Growth and Migration
Panama City is gaining residents at a pace most Florida cities outside the major metros can’t match.
| Year | Population |
|---|---|
| 2020 | 32,858 |
| 2021 | 34,178 |
| 2022 | 34,861 |
| 2023 | 35,969 |
| 2024 | 37,024 |
The city added 4,166 people from 2020 to 2024 — a 12.7% gain over four years. Growth has been steady, with each year showing increases of 700 to 1,300 residents. Hurricane Michael’s 2018 damage drove down the 2020 count, so part of this growth is a rebound. But the trajectory has held even after recovery.
Here’s how Panama City’s growth rate compares to other Florida cities:
| City | 2024 Population | 4-Year Growth |
|---|---|---|
| Port St. Lucie | 258,575 | +25.0% |
| Cape Coral | 233,025 | +19.2% |
| Panama City | 37,024 | +12.7% |
| Miami | 487,014 | +10.0% |
| Orlando | 334,854 | +8.8% |
| Tampa | 414,547 | +6.7% |
Panama City grew faster than Miami, Orlando, and Tampa. Only the Southwest Florida boom towns of Port St. Lucie and Cape Coral outpaced it.
Population growth at this pace usually pulls home prices up over time. The 2.2% annual price decline points to supply catching up with demand — likely from new construction since hurricane recovery — rather than weak housing demand.
Panama City Housing Market Trends
| Month | Median Value | Min ZIP | Max ZIP |
|---|---|---|---|
| Mar 2025 | $265,134 | $215,085 | $297,858 |
| Apr 2025 | $264,240 | $213,690 | $296,637 |
| May 2025 | $263,158 | $212,262 | $294,985 |
| Jun 2025 | $263,158 | $212,262 | $294,985 |
| Jul 2025 | $260,698 | $209,919 | $291,868 |
| Aug 2025 | $259,421 | $208,712 | $290,500 |
| Sep 2025 | $258,425 | $207,571 | $289,309 |
| Oct 2025 | $257,809 | $206,717 | $288,496 |
| Nov 2025 | $257,463 | $206,062 | $288,157 |
| Dec 2025 | $257,128 | $205,300 | $288,123 |
| Jan 2026 | $257,735 | $205,453 | $289,161 |
| Feb 2026 | $259,419 | $206,833 | $291,294 |
Prices fell every month from March through December 2025. The total decline came to $8,006, or about 3% off the peak.
Then something changed. December’s $257,128 was the low. January ticked up to $257,735. February jumped to $259,419 — a $1,684 monthly gain, the largest since the trend reversed.
Two months don’t make a trend. But the pattern across all three ZIPs is consistent. The cheapest ZIP bottomed at $205,300 in December and has since climbed back to $206,833. The most expensive ZIP did the same: $288,123 in December, $291,294 in February.
Is Panama City a Good Place to Buy in 2026?
The data points to a market that’s stabilizing after a year-long correction.
Buyers have the upper hand. Prices are still 2% below year-ago levels, and the market is small enough — three ZIPs, fewer than 40,000 residents — that inventory and pricing can vary significantly by listing.
The case for buying:
- Population grew 12.7% in four years, pulling demand
- The most affordable ZIP, 32401, beats renting on monthly cost
- February’s $1,684 month-over-month gain is the clearest reversal signal in a year
- Median price still sits below $260K, well under most Florida coastal markets
The case for waiting:
- Prices are flat to slightly negative on a 12-month basis
- Two months of gains aren’t a confirmed trend
- Florida insurance costs continue to weigh on total ownership costs
For a primary residence in 32401, the math favors buying now. For higher-end purchases in 32404 or 32405, the rent-buy gap is narrow enough that timing matters less than getting the right property.
Panama City Housing Market Outlook for 2026-2027
The 3-month trend is the clearest signal. From December to February, the median rose from $257,128 to $259,419 — a $2,291 gain, or 0.9%.
If the current pace continues, prices would reach roughly $263,000 by mid-2026 and challenge the $265,000 spring 2025 peak by late summer. That’s a meaningful “if.” Florida hurricane season runs June through November, and insurance market conditions can shift quickly.
The 12-month decline is also slowing. Year-over-year change was -3.2% in December, -2.7% in January, and -2.2% in February. Each reading is less negative than the last. If that pattern holds, prices could turn positive year-over-year by summer 2026.
Population growth gives the long-run trajectory upward support. A city adding 1,000+ residents annually with only three ZIPs of housing stock will see pricing pressure return.
Similar Markets in FL
If Panama City’s $259K median fits your budget, these Florida markets are worth comparing:
- Jacksonville — A larger market with stronger inventory but higher median prices.
- Tampa — More expensive than Panama City, with a deeper rental market and stronger job growth.
- Orlando — Higher prices than Panama City but a much larger metro economy.
- Homestead — A South Florida option with prices closer to Panama City than most coastal markets.
- Port Saint Lucie — Faster population growth (25% in four years) and a similar mid-sized city profile.
Frequently Asked Questions
What is the average home price in Panama City?
The average home price in Panama City, FL is $259,419 as of February 2026. That number reflects the Zillow Home Value Index across the city’s three ZIP codes, ranging from $206,833 in 32401 to $291,294 in 32405.
Are home prices going up or down in Panama City?
Down 2.2% year over year, but the decline is slowing. Prices fell every month from March through December 2025, then rose in both January and February 2026 — the first back-to-back monthly gains in over a year.
Is it cheaper to rent or buy in Panama City?
Renting is slightly cheaper citywide. Average rent runs $1,693 a month versus $1,750 to $1,850 for a typical mortgage with taxes and insurance. The math flips in ZIP 32401, where buying beats renting by about $90 a month.
What is the most affordable neighborhood in Panama City?
ZIP 32401 at $206,833 is the cheapest, sitting 20% below the city median. Rent there is also the lowest at $1,563 a month, making it the entry point for both owners and renters in Panama City.
Methodology
Home values are based on the Zillow Home Value Index (ZHVI), a smoothed measure of typical home values in the 35th to 65th percentile range. Rent estimates use the Zillow Observed Rent Index (ZORI). Population figures come from the U.S. Census Bureau Population Estimates Program (2020-2024 vintage). All datasets are publicly available. Housing data updated 2026-02-28.